Promo code "00LAYOUTS"
Professional Construction Venn PowerPoint Charts Template
Type: PowerPoint Charts template
Category: Venn
Sources Available: .pptx
Product ID: PC00358
Template incl.: 7 editable slides
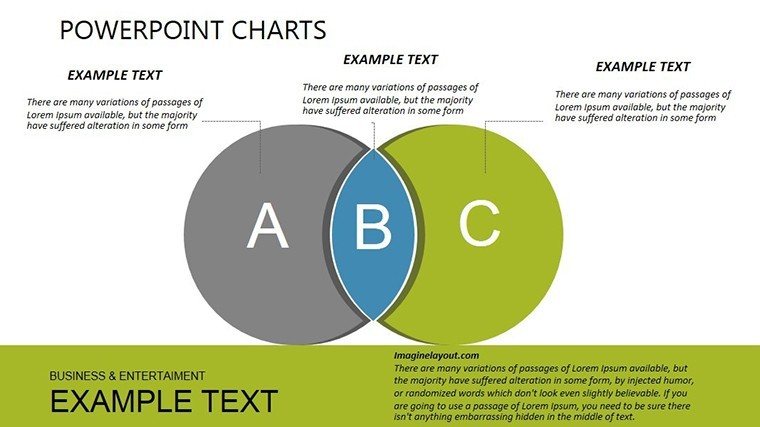
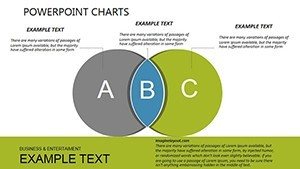
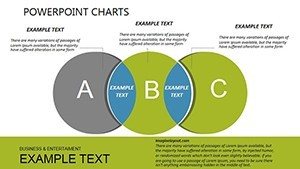
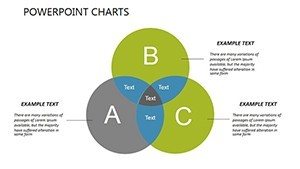
In the dynamic world of construction and project management, clarity in communication can make or break a deal. Our Professional Construction Venn PowerPoint Charts Template is tailored to help architects, engineers, and managers visualize overlaps and distinctions in complex projects. With 7 editable slides featuring versatile Venn diagrams, this template turns intricate data into digestible insights, ideal for stakeholder meetings or bid proposals. Drawing from industry standards like those from the American Institute of Architects (AIA), it ensures your presentations are not only visually appealing but also professionally grounded.
Envision presenting a site analysis where you compare zoning regulations, environmental impacts, and budget constraints - all intersecting in a clean Venn format. This approach fosters better decision-making, as seen in case studies from firms like Skidmore, Owings & Merrill, where visual tools accelerated project approvals. Whether you're outlining roles in a design-build team or contrasting material options, these charts provide the precision needed to convey expertise without overwhelming your audience.
Key Features That Set This Template Apart
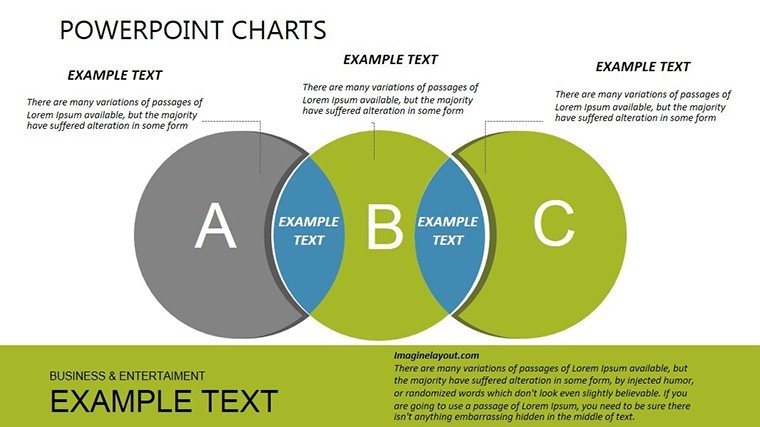
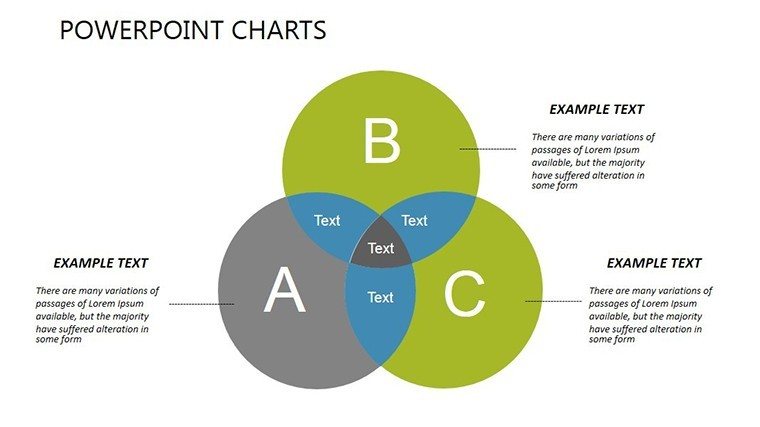
Built for usability, each slide offers high-quality, scalable graphics that adapt to any presentation size. From basic two-circle Venns for simple comparisons to multi-layered ones for detailed analyses, customization is straightforward - change colors to reflect project branding, add text for specific metrics, or incorporate icons like hard hats and blueprints for thematic relevance.
Unlike standard PowerPoint shapes, these are pre-optimized for construction themes, including elements like phase timelines and risk assessments. A report from McKinsey highlights that effective visuals can reduce meeting times by 24%, underscoring the time-saving benefits here.
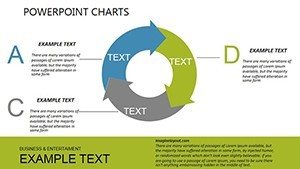
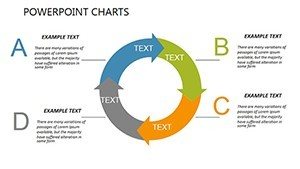
- Multiple Diagram Variations: Choose from 2-5 circle designs to match your comparison complexity.
- Easy Customization: No design expertise required; edit with familiar PowerPoint tools.
- Construction-Specific Icons: Enhance relevance with built-in symbols for tools, sites, and teams.
Practical Use Cases in Construction Projects
For architects pitching urban development, use Venns to show how sustainability goals intersect with cost efficiency and aesthetic demands. In engineering reviews, compare structural options like steel vs. concrete, highlighting shared benefits like durability while noting unique drawbacks.
Project managers benefit by mapping stakeholder responsibilities - overlaps in owner, contractor, and subcontractor roles can prevent conflicts, as evidenced by successful projects like the High Line in New York. Educators in construction management programs can employ these for teaching contract types, fostering interactive learning.
Workflow Integration and Best Practices
- Identify Key Elements: List factors to compare, such as timelines and resources.
- Build the Diagram: Populate circles with data, emphasizing intersections.
- Add Visuals: Incorporate project photos or charts for context.
- Review and Refine: Test with colleagues for clarity.
- Present Confidently: Use animations to reveal overlaps dynamically.
Integrate with software like Autodesk for data import, ensuring accuracy. Tips from AIA experts suggest limiting text to key phrases for maximum impact.
Advantages Over Basic Tools
Standard Venns lack thematic depth; this template embeds construction contexts, saving setup time and enhancing professionalism. It's compatible with Google Slides for collaborative edits on-site.
Unlock Project Clarity Now
Ready to streamline your construction communications? Download our Venn template and elevate your next presentation. Transform data into decisions - get started today.
Frequently Asked Questions
- How many circles can I add to the Venn diagrams?
- Up to five, with pre-designed layouts for easy expansion.
- Is it suitable for non-construction uses?
- Yes, adaptable for business or education, though optimized for construction.
- Does it support animations?
- Absolutely, add entrance effects for engaging reveals.
- Can I share it via cloud?
- Compatible with OneDrive or Google Drive for seamless collaboration.

