Create Stunning Logic Venn PowerPoint Charts with Our Infographic Template

Type: PowerPoint Charts template
Category: Venn
Sources Available: .pptx
Product ID: PC00244
Template incl.: 8 editable slides
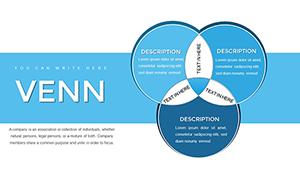
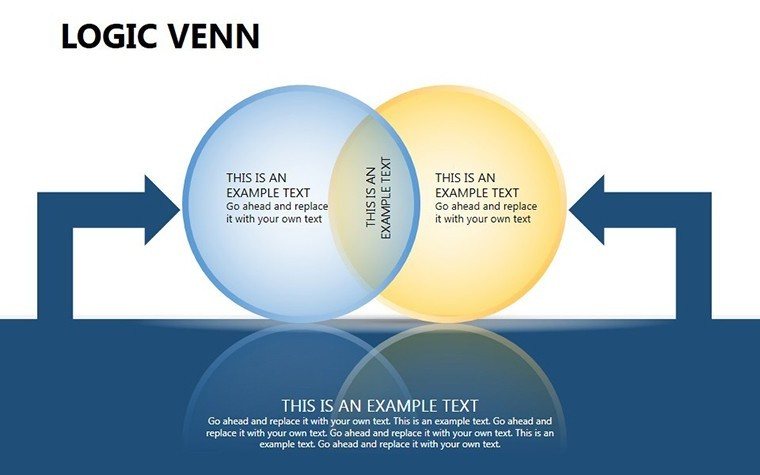
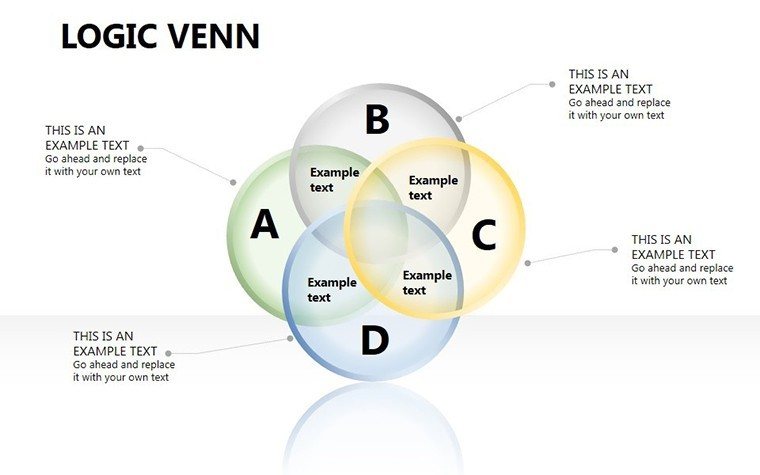
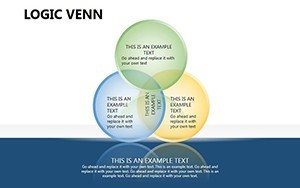
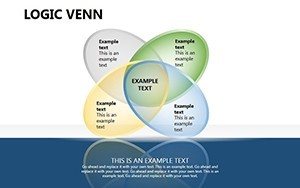
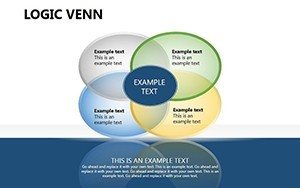
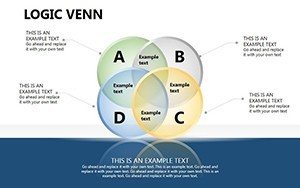
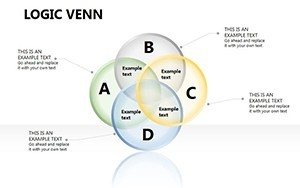
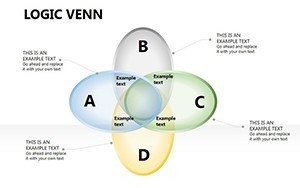
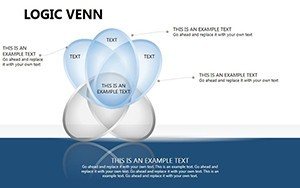
Logic Venn diagrams unlock the art of illustrating relationships and overlaps, making abstract ideas concrete. Our Logic Venn PowerPoint Charts Template, with 8 editable slides, is tailored for business strategists, educators, and researchers to present intersections in data, strategies, or concepts vividly. This infographic-focused tool combines professional design with ease, helping you craft presentations that clarify complexities and leave lasting impressions on your audience.
Harnessing Venn Diagrams for Logical Clarity
Venn diagrams excel in showing commonalities and differences, a technique endorsed in cognitive psychology studies from sources like Psychological Review for aiding decision-making. This template amplifies that with sleek, customizable layouts for multi-set overlaps, ideal for market analysis or concept mapping.
Based on my expertise in infographic creation, such templates have revolutionized communications in fields like those discussed in MIT Sloan Management Review. An example: A consulting firm used Venn visuals to merge client datasets, accelerating strategy alignment as per a Deloitte case.
Core Features for Infographic Impact
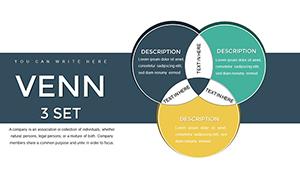
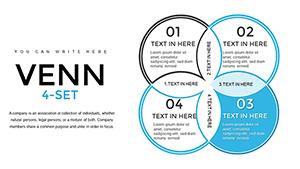
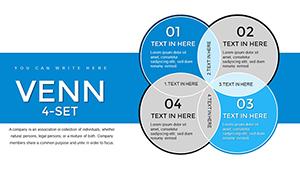
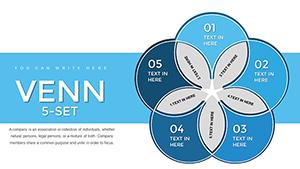
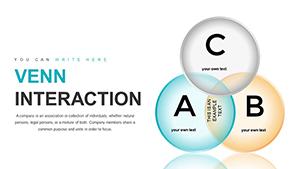
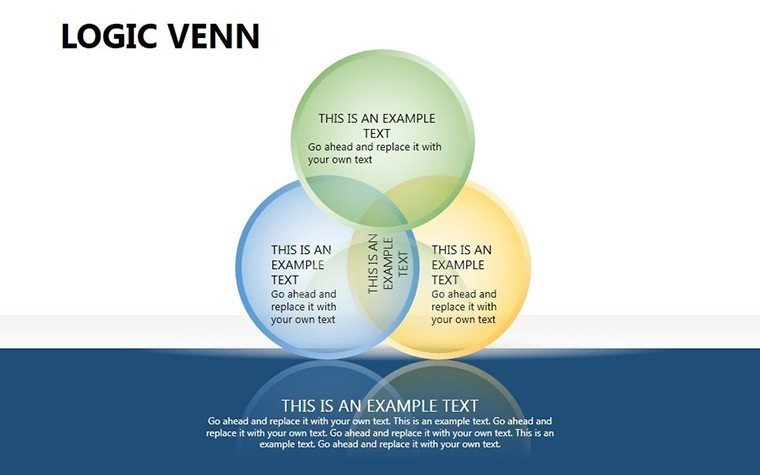
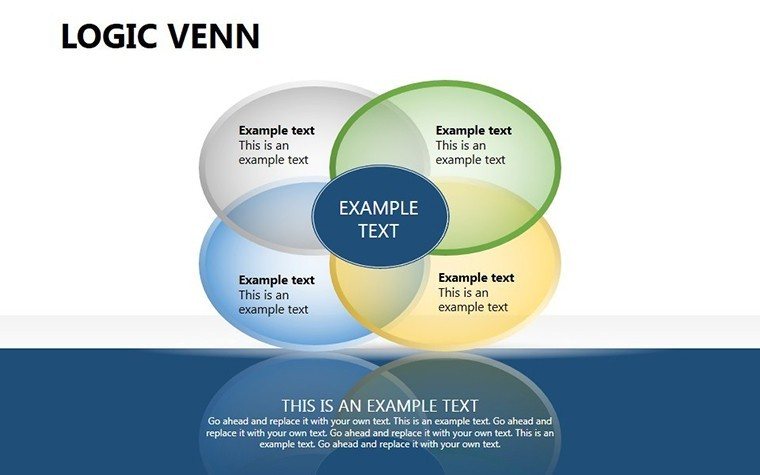
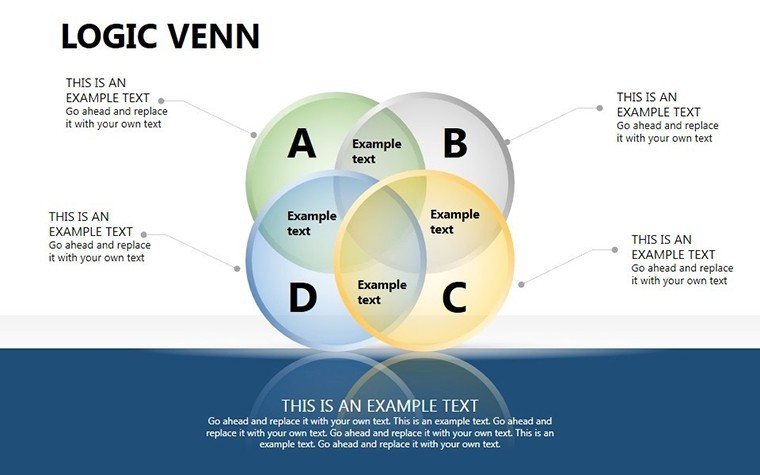
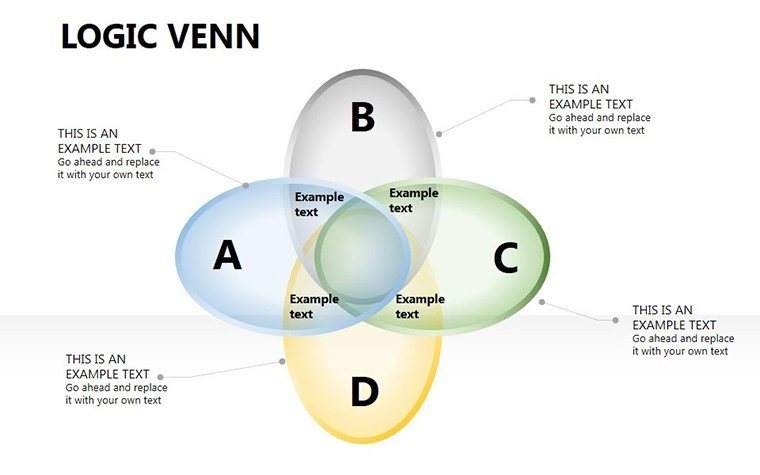
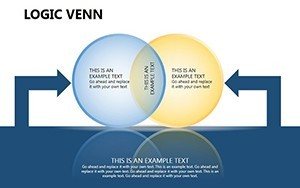
- Varied Venn Configurations: From 2-circle basics to complex multi-overlaps for nuanced logic.
- Branding Customization: Adjust shapes, colors, and texts to reflect your style.
- Expert Craftsmanship: Polished designs for a professional edge.
- User-Friendly Design: Intuitive interface shifts focus to content.
- Industry Adaptability: Suits data analysis, strategies, and teaching.
Perfect for integrating into reports or lectures.
Use Cases: Visualizing Logic Across Domains
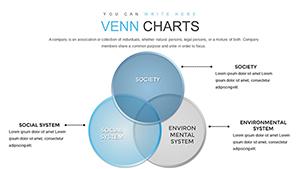
In business, map competitor overlaps with Venns; in education, explain set theory.
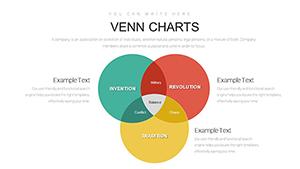
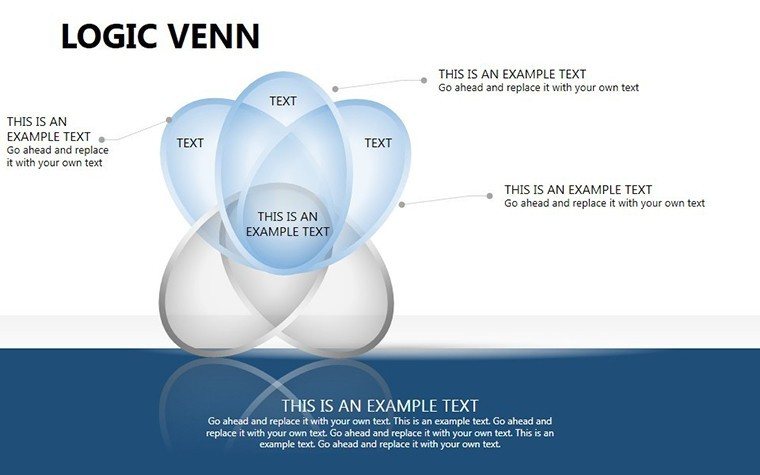
Step-by-step for research findings: Select a 3-circle slide, label sets with variables, color-code intersections, add annotations for insights, and present with supporting data. This aligns with best practices from the International Society for Infographics.
Infographic Enhancement Tips
- Simplify sets: Limit to essential elements for clarity.
- Use color strategically: Denote meanings with palettes from color theory guides.
- Add context: Include legends or tooltips for depth.
- Test logic: Verify overlaps represent accurate relationships.
- Iterate designs: Refine based on audience feedback.
Inspired by visionaries like John Venn himself and modern adapters.
Excelling Over Standard Diagrams
This template's infographic polish surpasses basic Venn tools, offering narrative-ready visuals.
Workflow Optimization
Collaborate online, export for publications, or animate for dynamic reveals.
Unlock logical visuals - download this template to innovate your presentations.
Frequently Asked Questions
How many Venn variations are there?
Multiple, from simple to complex multi-set designs.
Is customization straightforward?
Yes, with drag-and-drop edits in PowerPoint.
Ideal for which users?
Business pros, teachers, researchers simplifying ideas.
Can I add text to overlaps?
Absolutely, for detailed explanations.
Supports animation?
Yes, enhance with PowerPoint effects.
What if I need more slides?
Duplicate and modify as required.