Flow Funnel PowerPoint Template: 38 Editable Charts for Pipelines


Type: PowerPoint Charts template
Category: Flow
Sources Available: .pptx
Product ID: PC01112
Template incl.: 38 editable slides
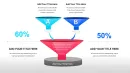
How to customize funnel stage widths for accurate conversion data
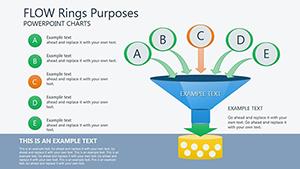
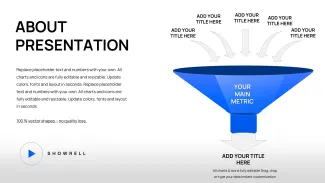
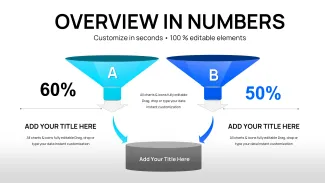
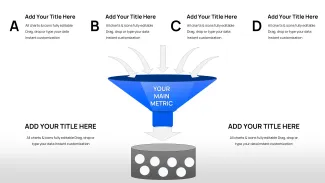
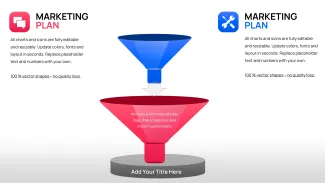
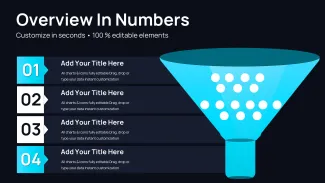
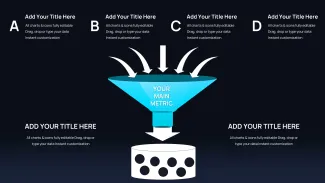
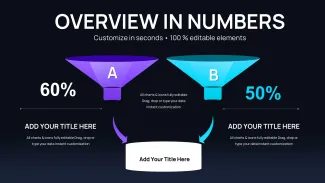
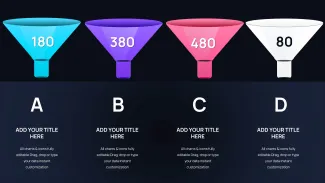
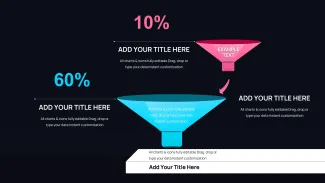
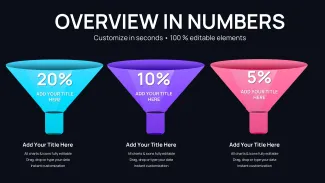
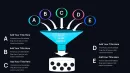
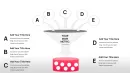
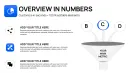
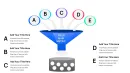
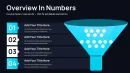
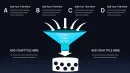
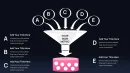
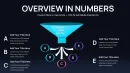
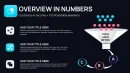
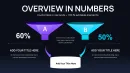
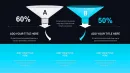
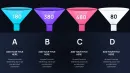
The thing about funnel charts is they make drop-off points obvious in a way tables never do. This flow funnel PowerPoint template gives you 38 slides covering everything from simple 3-stage overviews to detailed 6-stage breakdowns with branching paths. Sales teams use them when explaining pipeline health to leadership. Basically the narrowing shape shows volume changes without extra explanation.
In practice when I opened similar templates for a client quarterly review the column alignment and segment proportions held even after heavy data swaps. You know that moment when the deck is due at 9am - this setup gets the summary slide done fast.
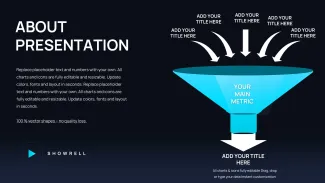
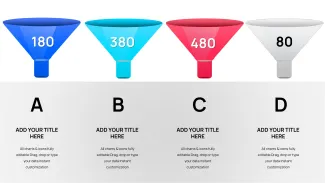
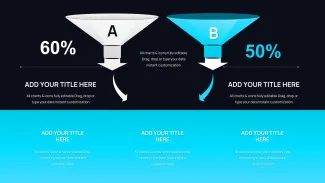
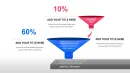
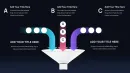
It works best for showing progression where quantity decreases: leads to opportunities to closed deals or applicants to hires. But it isn't great for flat processes where numbers don't taper. Honestly the vector elements stay crisp when projected.
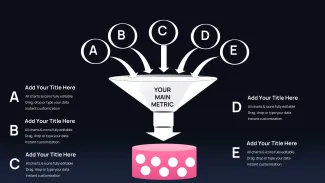
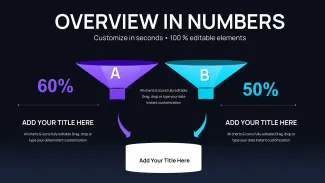
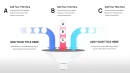
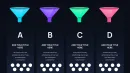
Compared to standard bar charts these funnels force the eye down the stages. Versus pie charts they handle sequences better. The 38 variations mean you pick the right complexity instead of forcing one layout.
Real editing experience with funnel charts
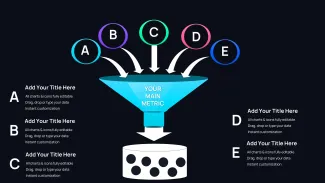
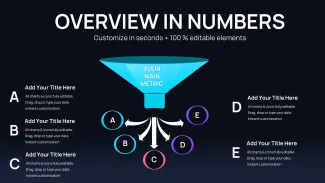
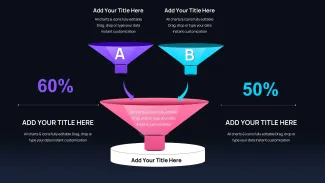
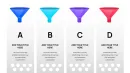
Select a segment click and drag to adjust width based on actual numbers. Labels and callouts move with the shapes. Color switching happens through the slide master - first time it looks messy but the system is straightforward once you see the theme colors. And you can ungroup everything for full control. No extras.
This beats starting from scratch because someone already solved the alignment issues across 20+ slides the border rendering and consistent font stack. You focus on your numbers.
| Feature | Details |
|---|---|
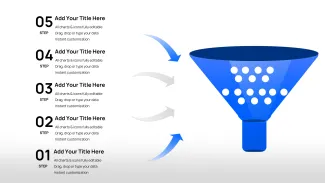
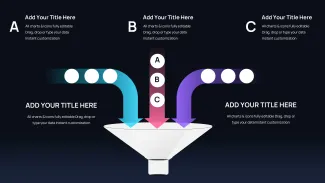
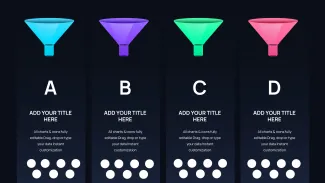
| Slides / diagrams | 38 slides with 3-6 stage funnels horizontal variants branching paths and dashboards |
| File format | .pptx fully editable vector shapes |
| Software version | PowerPoint 2016+ compatible elements resize and recolor independently |
| Color schemes | Multiple via theme colors - select segments and update master for brand match |
| Editable elements | Widths adjust proportionally to data labels and callouts move automatically |
| Aspect ratio | 16:9 default works on widescreen displays |
| Best used for | Flow funnel PowerPoint template scenarios like pipeline reviews process mapping and conversion analysis |
You can link text fields to Excel for quicker updates. Works as-is for most cases.
How do I change colors in this flow funnel PowerPoint template?
Go to View > Slide Master. Locate the funnel color placeholders at the top level and update the theme colors there. Then return to normal view and the changes apply across all 38 slides consistently. In most cases this is faster than editing each segment manually. Honestly it looks intimidating first but saves hours later.
What license allows client work with these templates?
Standard purchase lets you use them in client projects as long as you don't resell the files themselves. From experience most agencies do this without issues. Check the exact terms on the download page for any extra conditions.
Free vs paid differences in funnel templates
This paid version includes the full 38 slides with advanced branching reverse and comparative layouts. Free options elsewhere usually have fewer stages and less flexibility. To be honest the extra configurations make a real difference when you need variety for different audiences.
What refund conditions apply?
Standard digital download policy usually means no refunds after access is granted since files are instantly available. Contact support if you run into technical compatibility problems though. They tend to be helpful with PowerPoint issues.
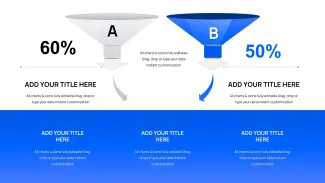
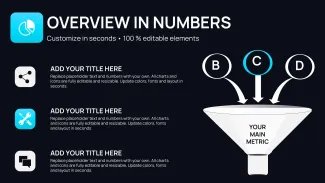
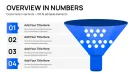
Best metrics to display at each stage of a sales funnel PowerPoint
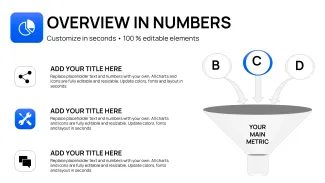
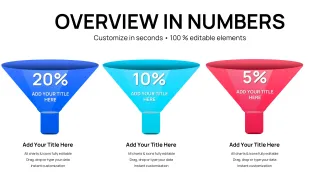
Include incoming volume conversion rate to next stage and maybe average value or time in stage. So basically show both the quantity drop and why it happens. Add variance from target - executives spot problems faster that way. Oh and keep labels short.