Agile Scrum Methodology Process Flow PowerPoint Charts


Type: PowerPoint Charts template
Category: Business Models
Sources Available: .pptx
Slide size: widescreen (16:9)
Product ID: PC00829
Template incl.: 16 editable slides
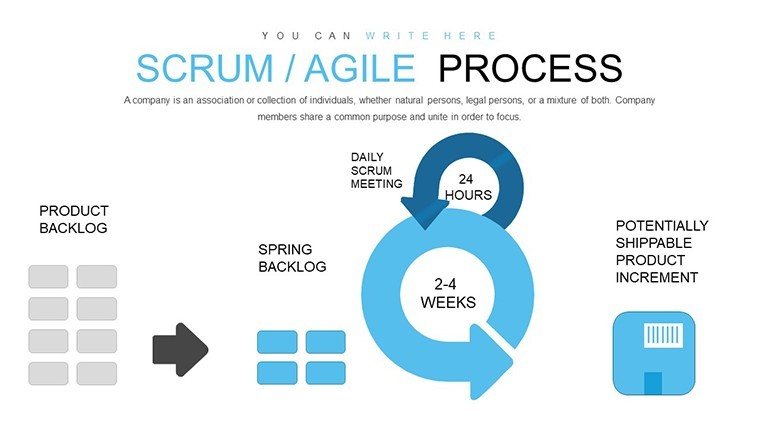
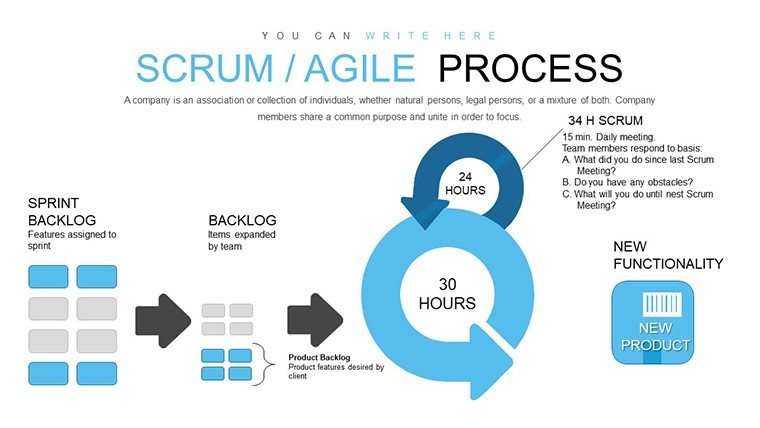
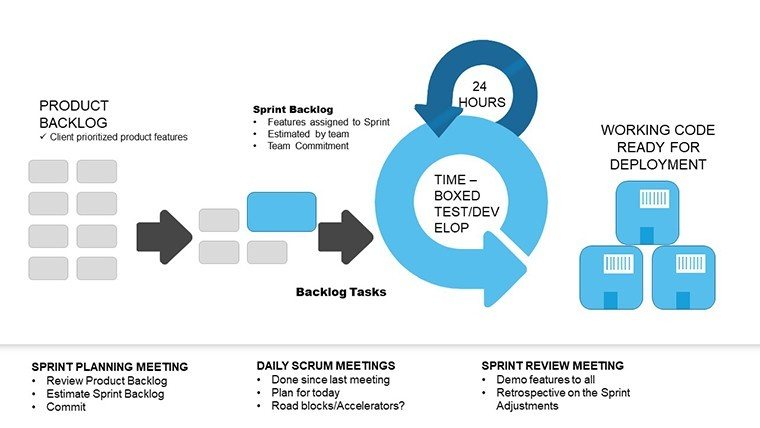
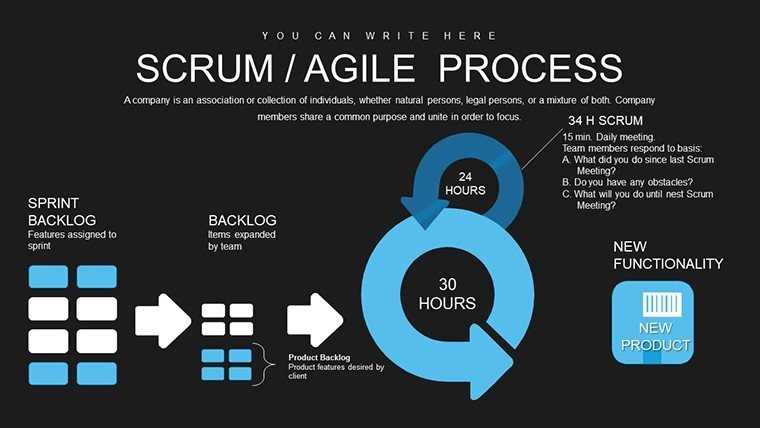
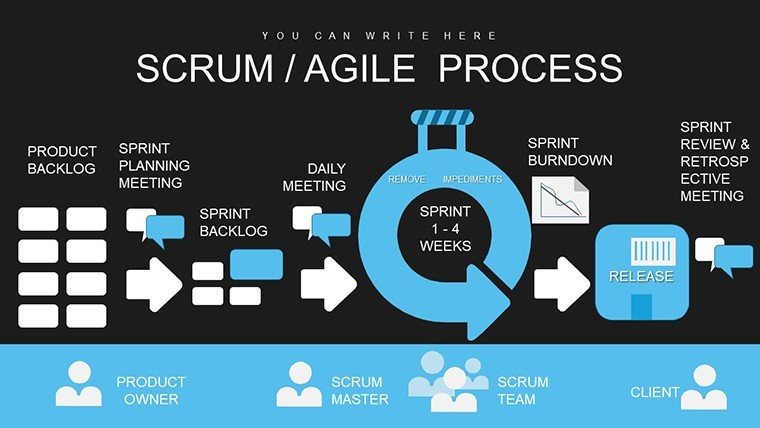
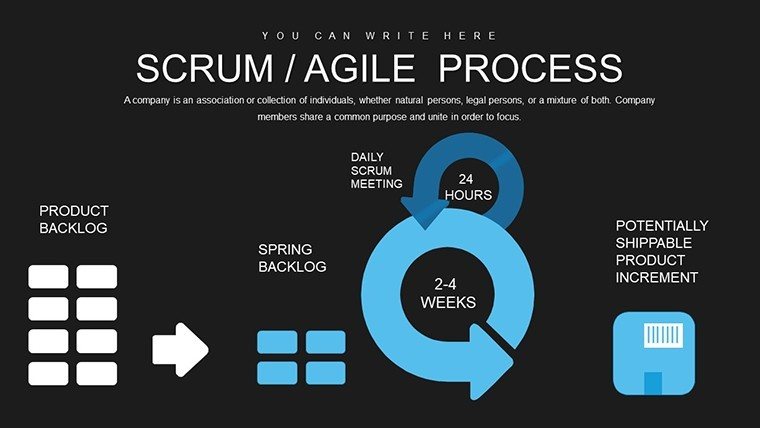
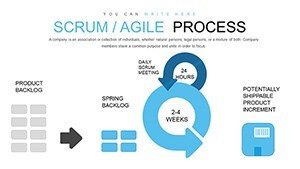
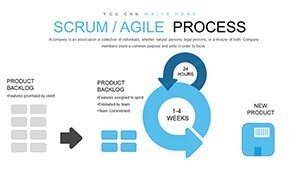
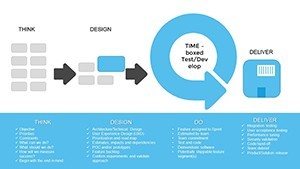
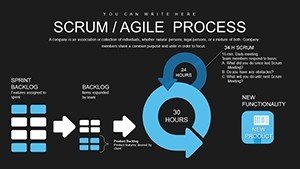
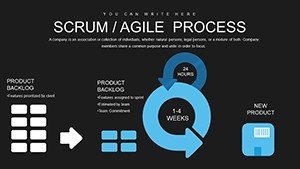
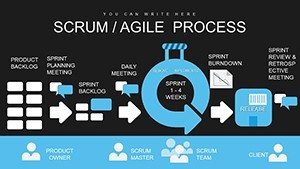
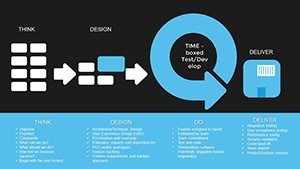
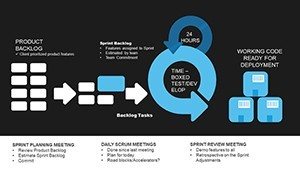
Software development thrives on agility, where adapting to change is key. Our Agile Scrum Methodology Process Flow PowerPoint Charts template equips developers with the tools to visualize this dynamism. Featuring 16 widescreen slides, it breaks projects into user stories and iterations, aligning with Scrum's iterative ethos for two-week cycles.
Drawing from practices at tech leaders like Apple, where Scrum accelerates product cycles, this template simplifies complex flows. Editable in PowerPoint, it's ideal for modeling software from backlog to deployment. Embrace a presentation style that mirrors your code's efficiency - clean, iterative, and impactful.
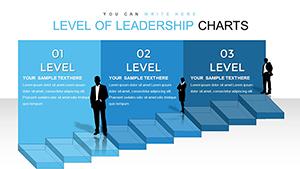
Core Components of Scrum Visualization
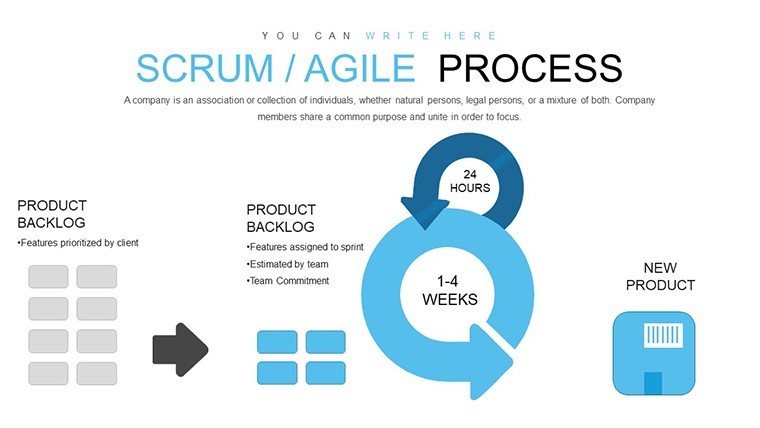
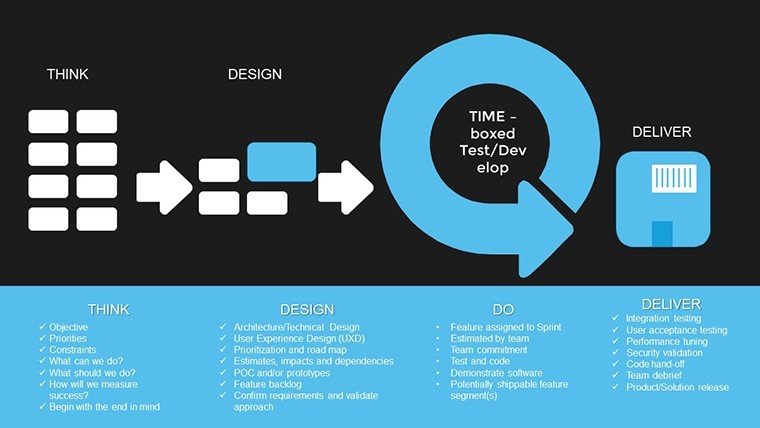
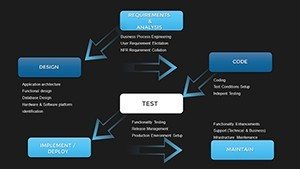
This template distills Scrum into visual essence, with flowcharts mapping user story prioritization and iteration resolutions. Each slide supports data entry for real-time updates, ensuring your process flows reflect current project states.
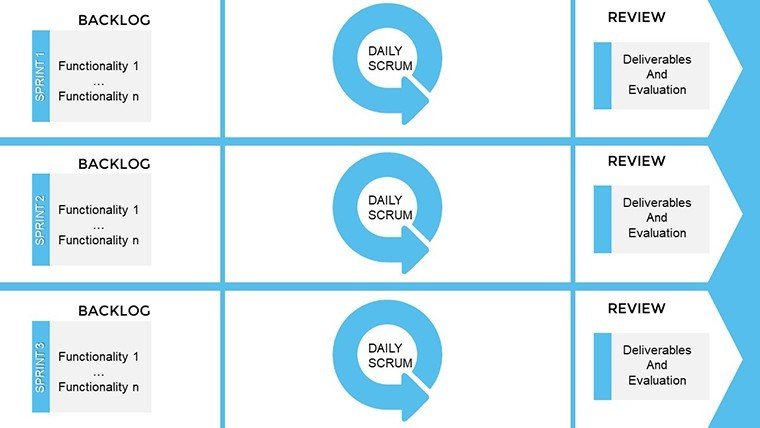
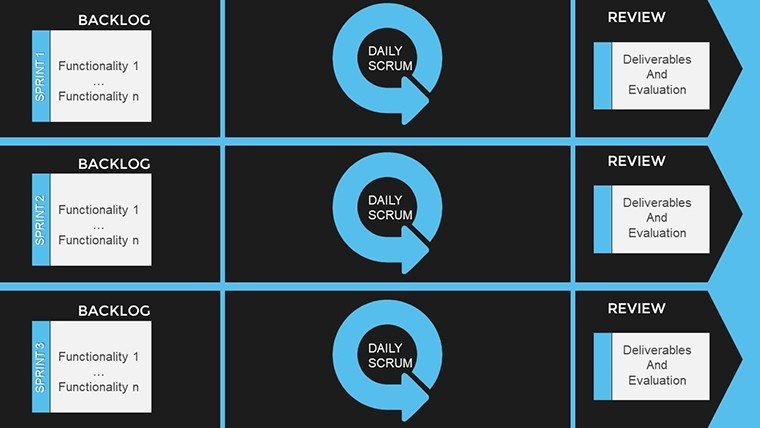
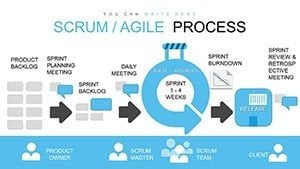
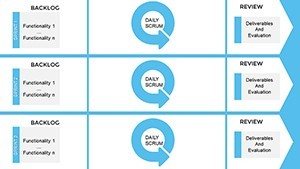
For developers tackling a new feature rollout, Slide #4's iteration cycle diagram allows mapping epics to sprints, highlighting priorities. This visual aid, akin to GitHub's workflow integrations, aids in spotting dependencies early.
Highlighting Template Innovations
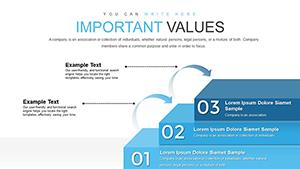
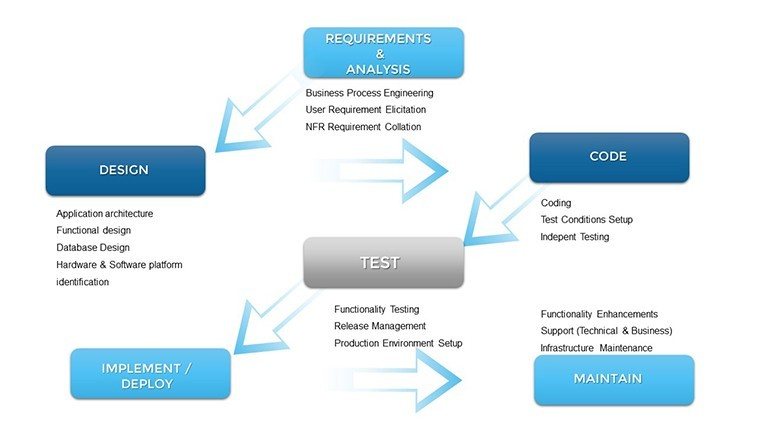
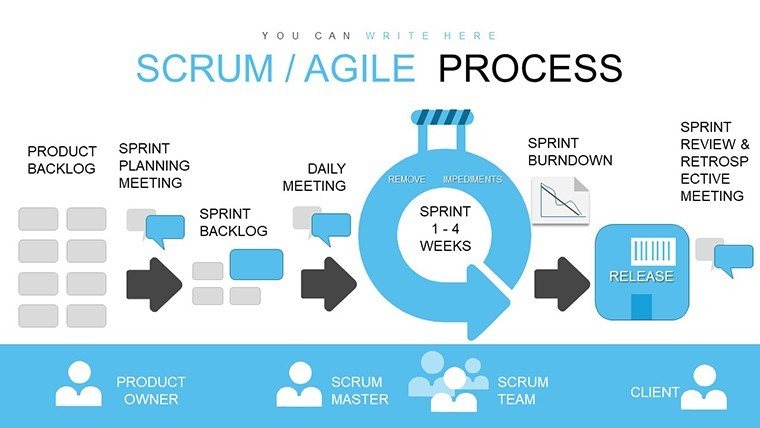
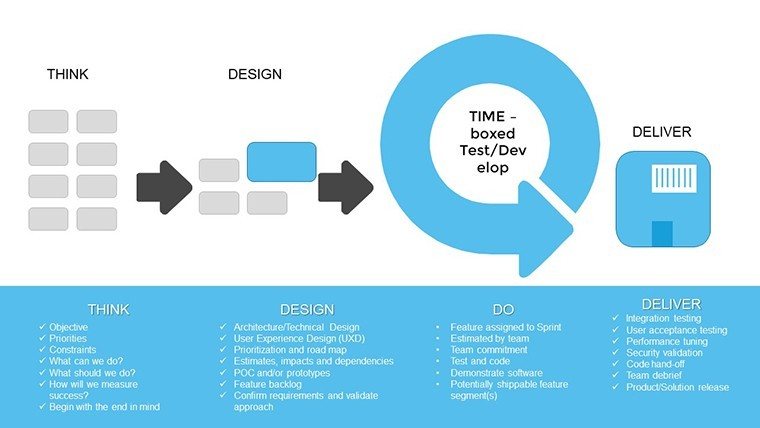
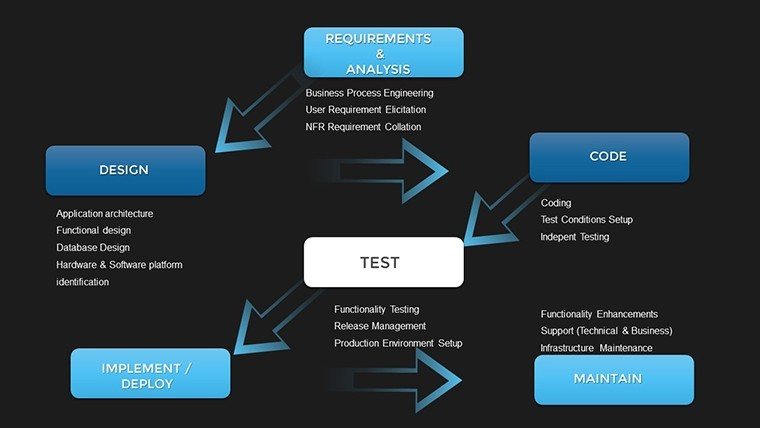
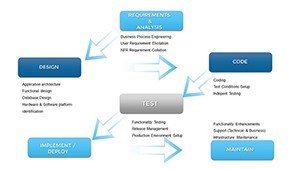
- Process Flow Diagrams: Detailed paths from backlog to done, with branching for alternatives.
- User Story Templates: Structured cards for 'As a... I want... so that...' formats.
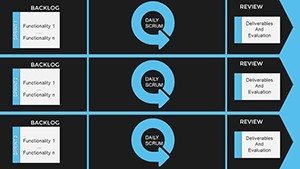
- Iteration Timelines: Gantt-style views for two-week sprints, adjustable for scope.
- Widescreen Optimization: Perfect for virtual demos or large screens.
- Editable Layers: Peel back elements for in-depth explanations.
These elements foster a deeper understanding, reducing bugs through better planning.
Integrating into Developer Workflows
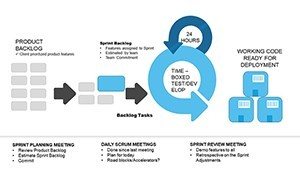
In practice, this template shines during code reviews or planning poker sessions. Use Slide #9 to flowchart merge requests, visualizing branch merges and conflict resolutions - much like open-source projects on GitLab.
For solo devs or small teams, customize retrospectives with flow adjustments, identifying cycle bottlenecks. Larger enterprises can scale it for portfolio overviews, as seen in IBM's Agile transformations.
Step through a typical use: In a bi-weekly planning, populate Slide #2 with user stories, assign points, and forecast velocity. This proactive visualization aligns with Scrum's empirical pillars, promoting adaptive development.
Guide to Tailoring Your Charts
- Open in PowerPoint and select a flow slide.
- Input project specifics, like story details and timelines.
- Modify arrows and nodes for custom paths.
- Add colors to denote priorities or risks.
- Present iteratively, gathering feedback for refinements.
- Save versions for historical tracking.
This workflow mirrors Scrum's inspect-and-adapt cycle.
Elevating Beyond Generic Charts
Unlike PowerPoint's defaults, this template embeds Scrum semantics, ensuring flows adhere to principles like time-boxing. Its widescreen format and editability provide superiority, with users noting faster alignment in dev teams.
Build trust in your processes - acquire this template and flow through development with ease.
FAQ
How do the flows handle complex projects?
They support branching and nesting for multifaceted stories.
Compatible with dev tools?
Yes, integrate screenshots from IDEs or repos.
Suitable for non-devs?
While dev-focused, it's adaptable for any iterative process.
Can I add more flows?
Duplicate slides and extend as needed.
Includes examples?
Pre-populated with sample software scenarios.