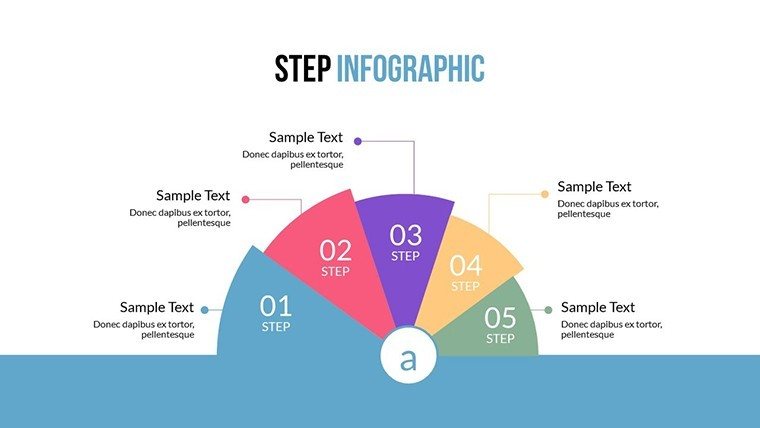
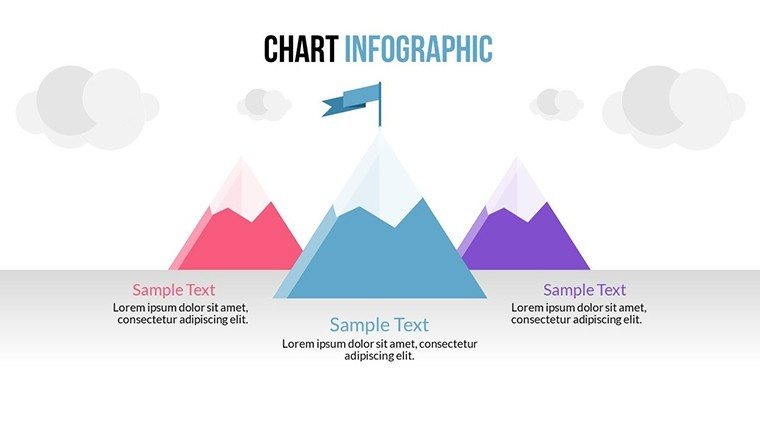
Step and Cycle Infographic PowerPoint Charts: Visualize Processes with Ease


Type: PowerPoint Charts template
Category: Cycle
Sources Available: .pptx
Product ID: PC00493
Template incl.: 22 editable slides
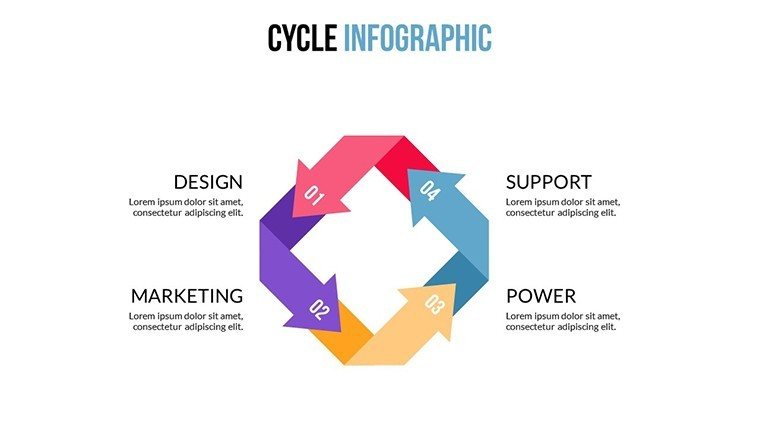
Imagine holding your audience's attention as you unravel intricate processes, making the complex seem straightforward. Our Step and Cycle Infographic PowerPoint Charts Template does just that, offering 22 editable slides dedicated to depicting sequences, loops, and progressions. Crafted for those who thrive on clarity, this template is a boon for project managers mapping out development phases, teachers illustrating life cycles in science classes, or sales teams outlining customer acquisition funnels. By leveraging cycle designs inspired by agile methodologies, it ensures your narratives flow logically, reducing confusion and boosting retention. Drawing from cognitive psychology principles, like those in Don Norman's design work, the visuals prioritize user intuition, allowing viewers to grasp ideas faster. Whether you're presenting quarterly roadmaps or training modules, this tool turns abstract concepts into tangible diagrams, enhancing your credibility as a communicator.
Essential Features That Power Your Visual Narratives
This template's strength lies in its blend of functionality and aesthetics. With over 20 pre-designed slides, each one is optimized for high-resolution displays, ensuring no pixelation during keynotes. Cycle charts loop seamlessly to show recurring processes, while step infographics build incrementally for phased explanations. Customization options abound: Alter hues to reflect seasonal themes, resize elements without distortion, and embed animations for dynamic reveals. Compatible with PowerPoint and adaptable to Google Slides, it's built for modern workflows. No design background? No problem – the intuitive layout guides you through edits, saving precious time. Compared to stock PowerPoint shapes, which can feel rigid, these infographics offer fluidity, perfect for adapting to evolving project needs.
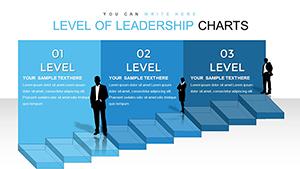
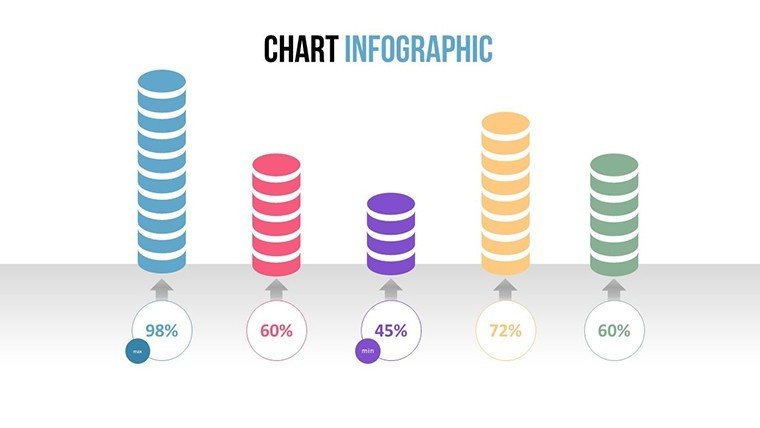
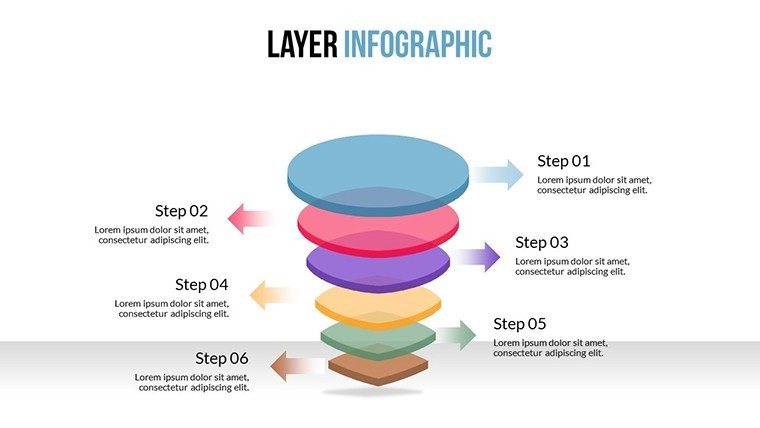
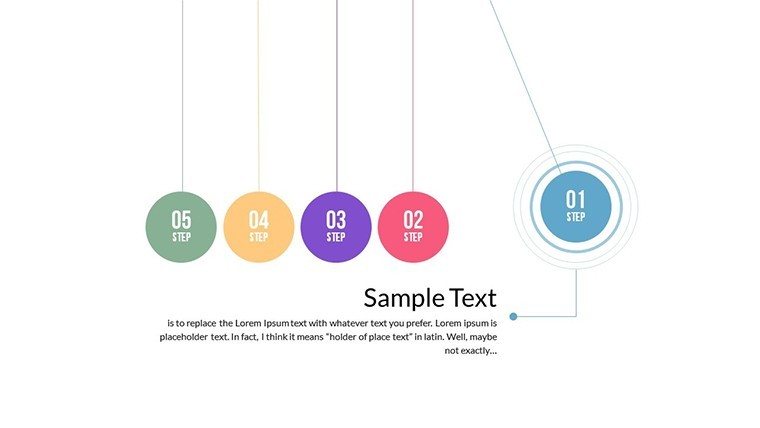
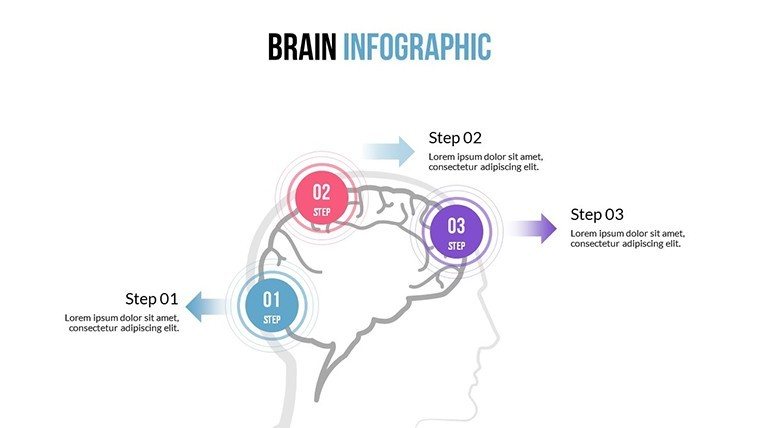
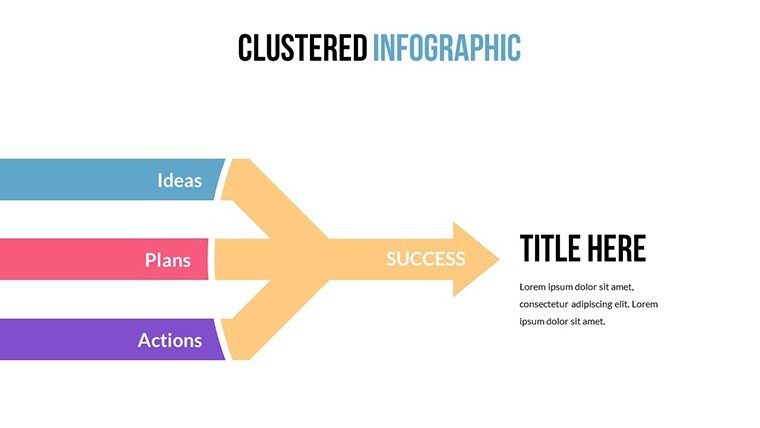
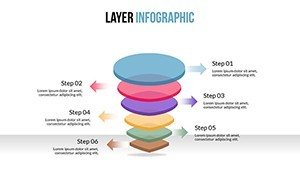
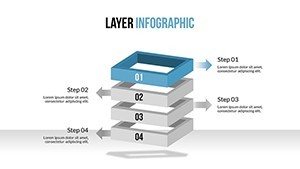
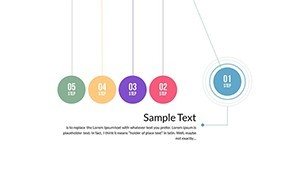
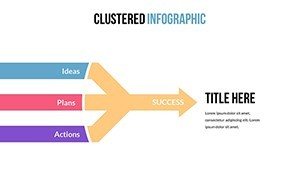
- Pre-Designed Step Slides: Sequential layouts for timelines and procedures.
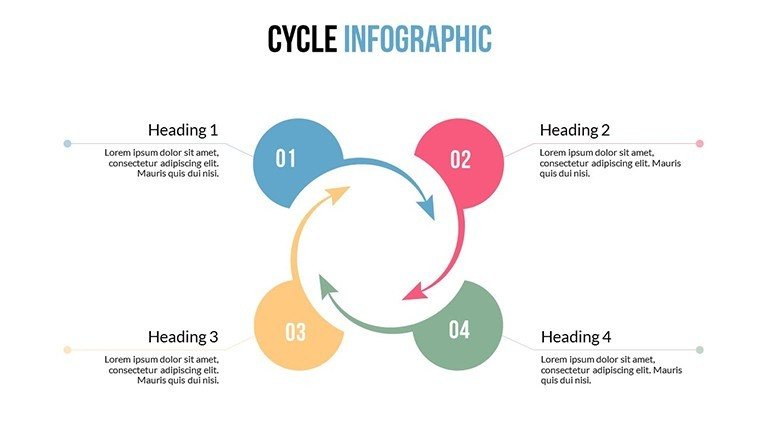
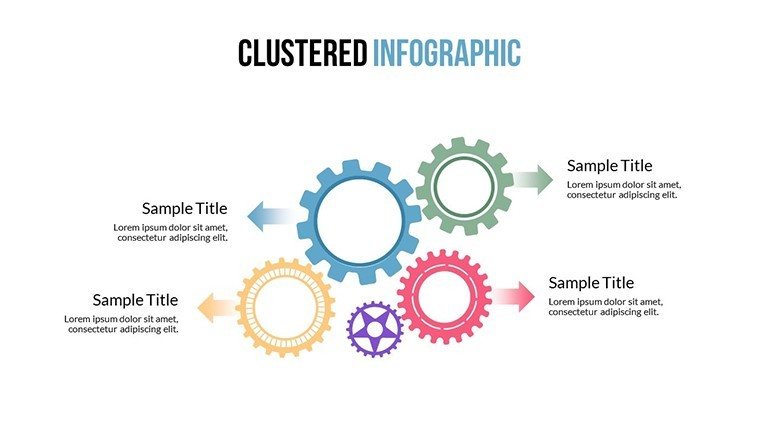
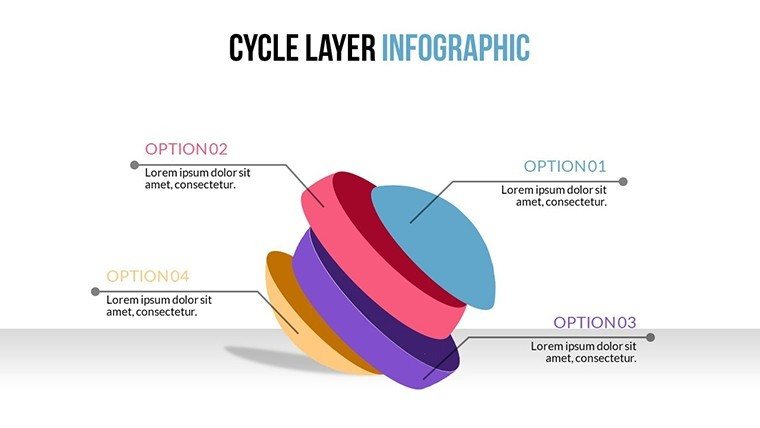
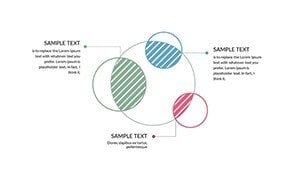
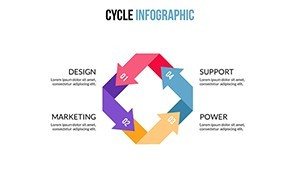
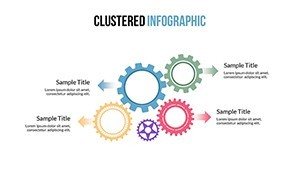
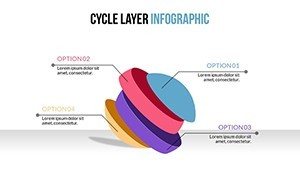
- Cycle Infographic Variety: Circular designs for feedback loops and iterative processes.
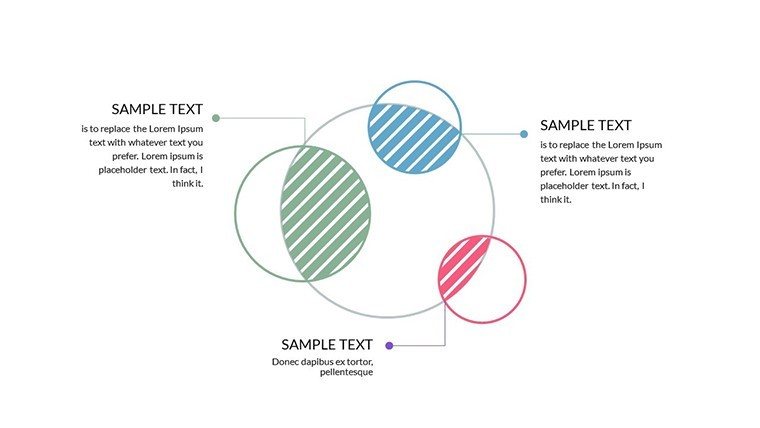
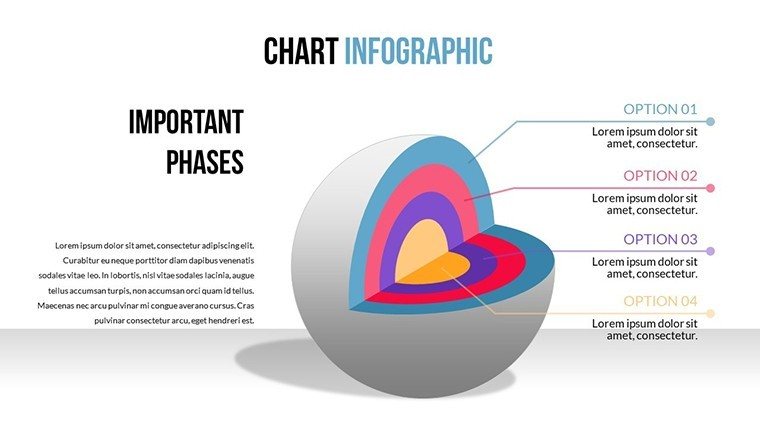
- High-Quality Editable Graphics: Resize and recolor without quality loss.
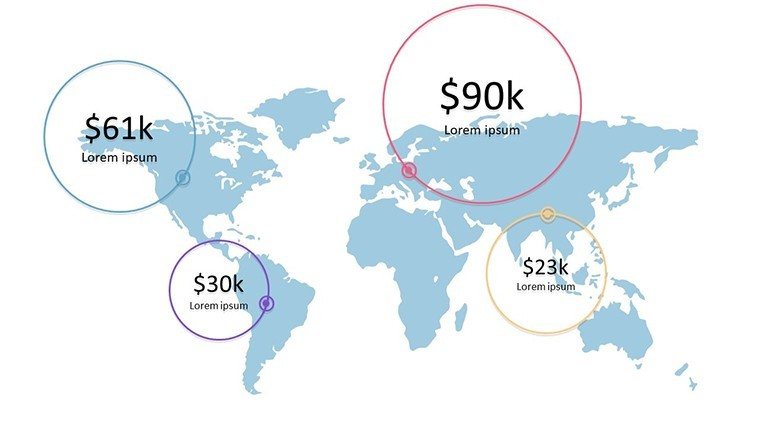
- Instant Customization Tools: Fonts, colors, and data integration at your fingertips.
- Professional Visuals: Ready for business or educational use.
Delivering Tangible Benefits for Everyday Users
The impact? Enhanced engagement and comprehension. Research from the Harvard Business Review highlights how visual aids like cycles can improve decision-making by 25%. For businesses, this means clearer strategy sessions; picture a team using step charts to dissect supply chain bottlenecks, leading to faster resolutions. Educators benefit by simplifying topics – a biology teacher might use cycle infographics to explain photosynthesis, making lessons interactive and fun. The template's data-driven approach allows real-time updates, ideal for agile environments where plans shift. Plus, with built-in themes, your presentations maintain brand consistency, fostering trust. In essence, it's not just slides; it's a catalyst for better outcomes, from winning client approvals to inspiring student breakthroughs.
Practical Workflow: From Download to Delivery
- Secure the .pptx download and launch in PowerPoint.
- Choose a cycle or step slide matching your content flow.
- Populate with data, perhaps linking to spreadsheets for accuracy.
- Tweak visuals: Add icons for emphasis or animations for pacing.
- Rehearse transitions to ensure smooth storytelling.
- Share via export or present live, adapting on the fly.
This methodical approach encourages experimentation – try varying cycle directions for emphasis on progression versus regression. Unlike basic tools, our template includes subtle gradients and shadows for depth, elevating mundane data to professional artistry.
Diverse Use Cases: Adapting to Your Professional Needs
Adaptability shines in varied scenarios. Project managers can chart sprint cycles in software development, aligning teams on deadlines per Scrum standards. Businesses pitching services might use step infographics to outline implementation phases, reassuring clients with visual roadmaps. In education, trainers could depict historical revolutions as cycles, highlighting cause-and-effect loops for deeper insight. Consider a case study: A non-profit used these charts to visualize donor engagement cycles, resulting in a 15% uptick in contributions through clearer calls to action. Analysts might adapt for risk assessments, stepping through mitigation strategies. Integration tips include combining with tools like MindMeister for mind mapping imports, or using in hybrid meetings for collaborative edits. Always prioritize accessibility – high-contrast colors ensure inclusivity, aligning with ADA recommendations. Ultimately, this template empowers you to weave narratives that resonate, turning information overload into enlightened discussions.
Ready to streamline your communications? This isn't just a download; it's an investment in your presentation prowess, evolving with your needs through user-inspired updates.
Frequently Asked Questions
Are the step and cycle charts fully editable?
Yes, every aspect from shapes to text can be modified to fit your unique requirements.
Does this work with older PowerPoint versions?
It supports PowerPoint 2010 and later, with full features in newer editions.
How do I add my own data to the infographics?
Simply edit the placeholders or link to Excel for automatic population.
Is animation included in the slides?
Basic animations are pre-set, but you can customize or add more via PowerPoint tools.
Can I use this template for team collaborations?
Certainly, share the file for group edits, ideal for remote work setups.