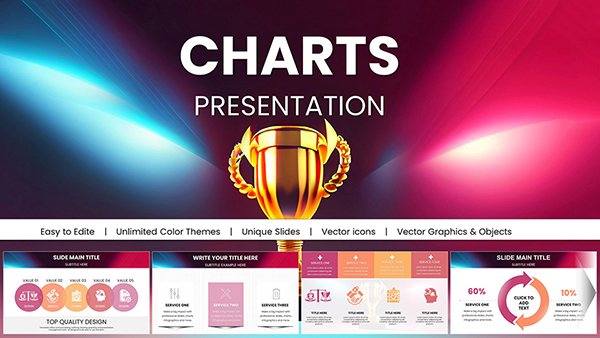
Business Infographic PowerPoint Charts Template - Download Presentation


Type: PowerPoint Charts template
Category: Business Models, 3D
Sources Available: .pptx
Product ID: PC00479
Template incl.: 21 editable slides
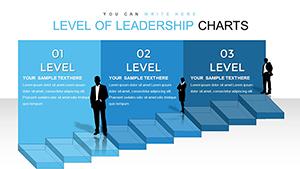
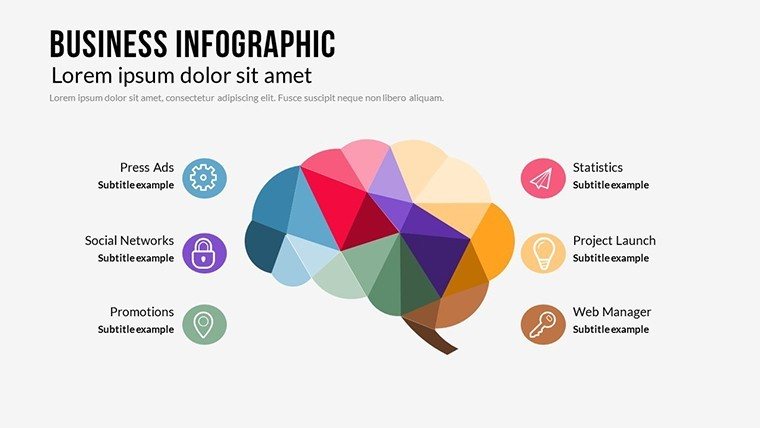
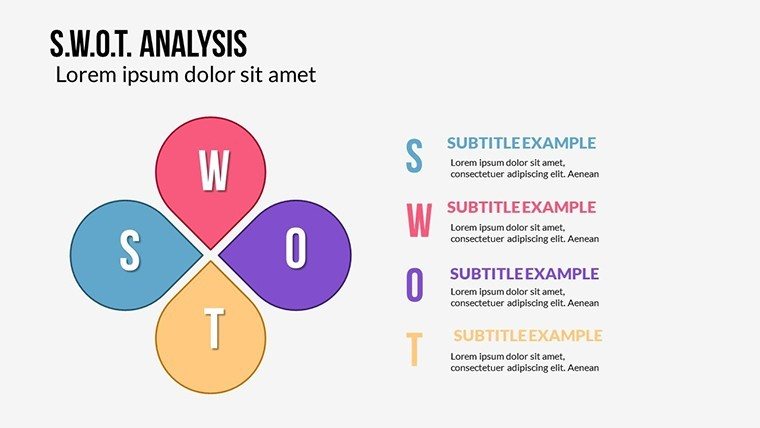
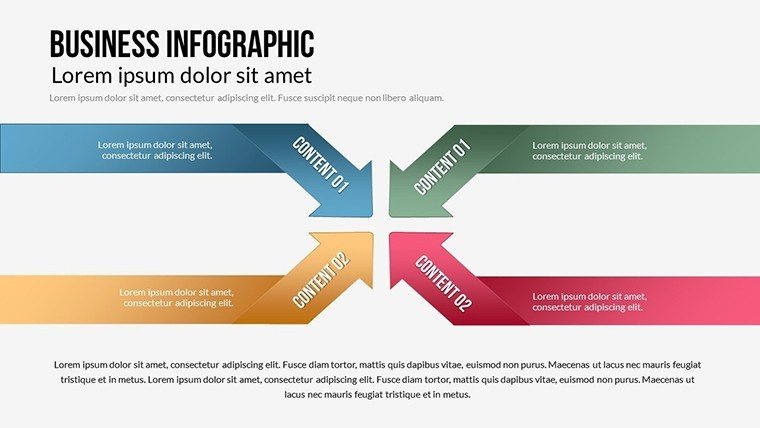
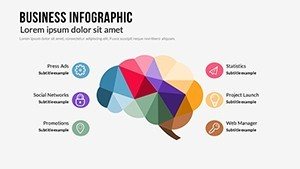
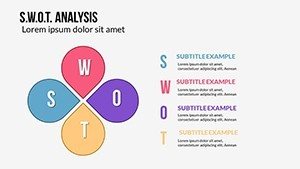
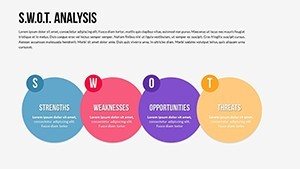
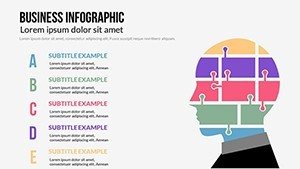
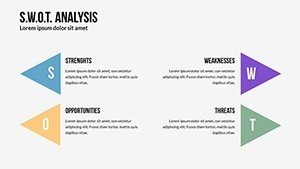
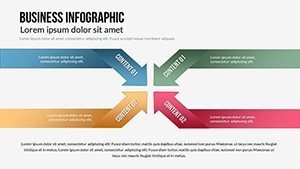
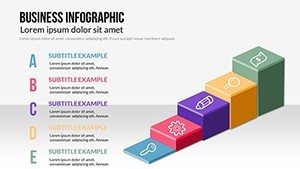
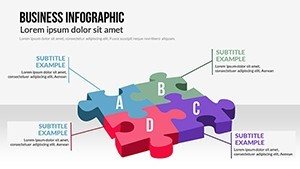
In the realm of business, where ideas compete for attention, visual prowess can tip the scales. Our Business Infographic PowerPoint Charts template, with 21 editable slides, merges business models and 3D visuals to craft presentations that persuade and perform. Geared toward entrepreneurs, marketers, and analysts, it enables you to depict strategies with flair. Think of rendering a SWOT analysis in 3D for added emphasis, or outlining a business canvas that invites collaboration. This template streamlines the path from concept to conviction, equipping you with tools to make data dance and decisions follow.
Delving into Business Models and 3D Enhancements
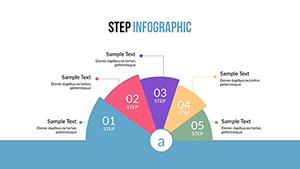
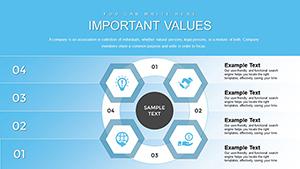
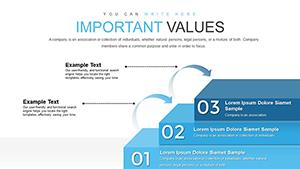
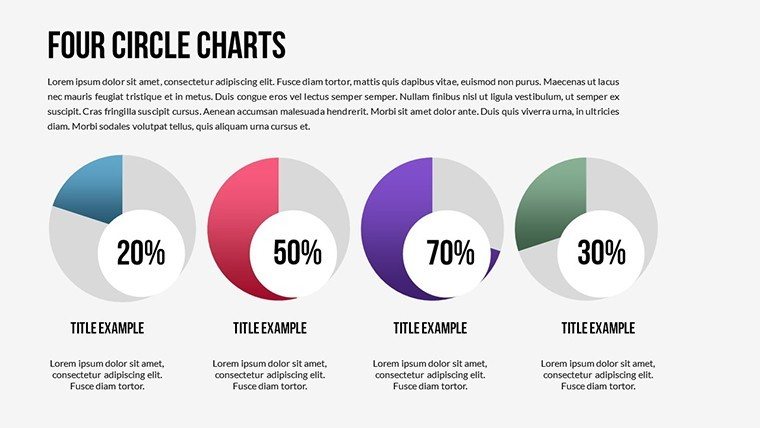
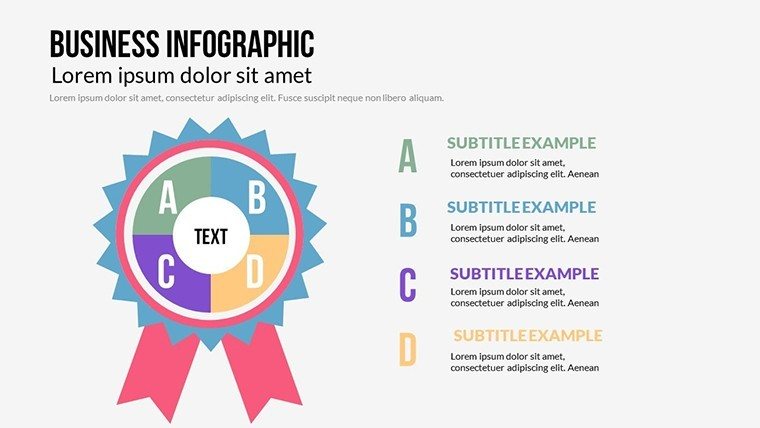
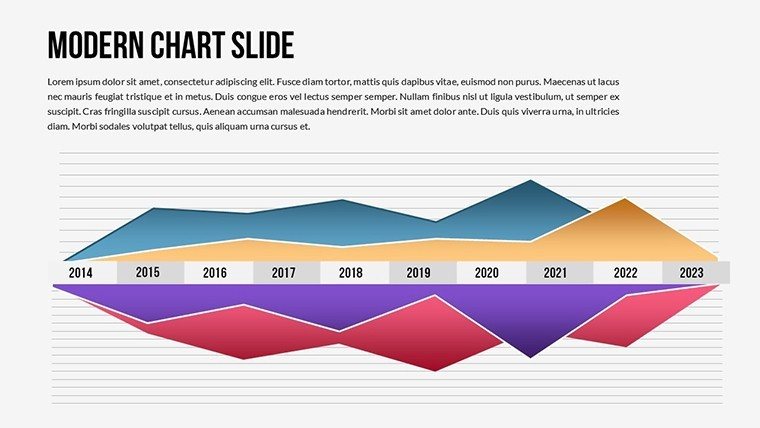
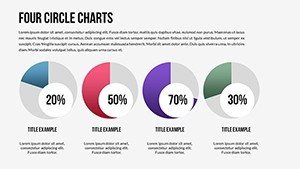
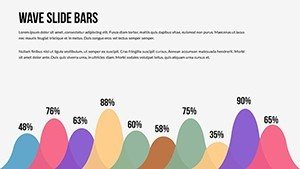
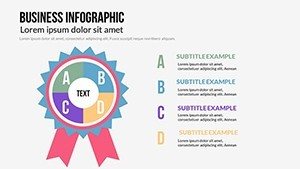
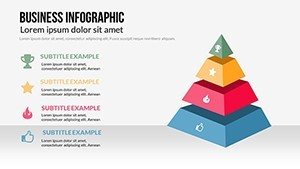
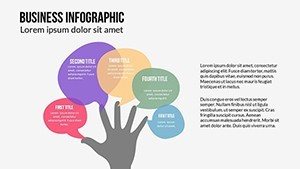
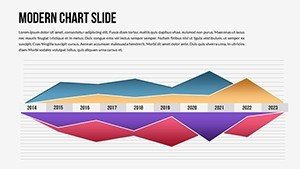
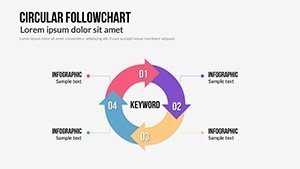
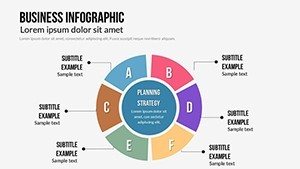
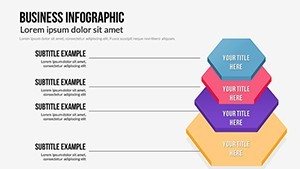
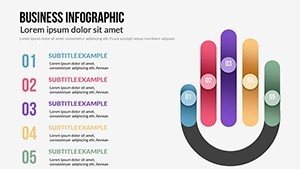
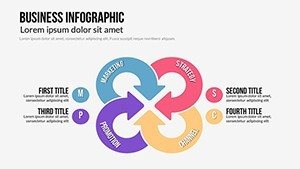
The template's strength lies in its fusion of structured business models - like value propositions and revenue streams - with immersive 3D charts. These elements allow for multifaceted views, such as rotating pie charts that reveal segment details. Tailor every aspect: Fonts, gradients, and layouts adapt to your vision. High-definition renders ensure vibrancy, making slides suitable for boardrooms or webinars. Whether modeling a startup's growth trajectory or a corporation's market share, the designs provide depth and dimension that flat graphics can't match.
Empowering Business Scenarios with Visuals
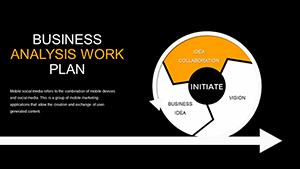
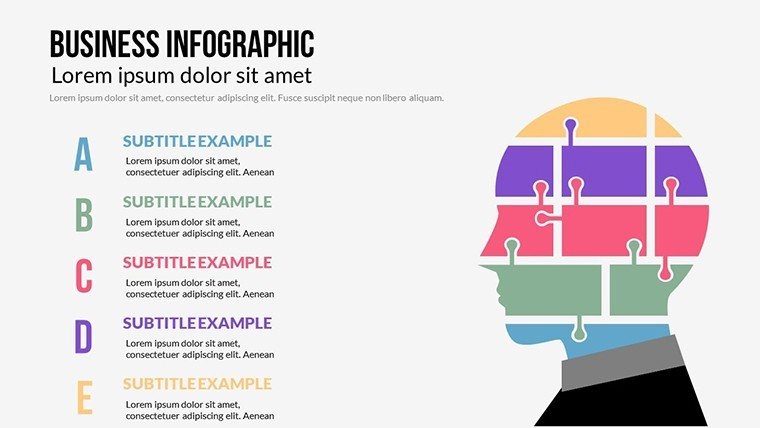
Entrepreneurs can use it to pitch business plans, with 3D infographics illustrating market penetration strategies that captivate investors. A startup founder reported closing a funding round faster after using similar visuals to highlight unique value props. Marketers might deploy model slides for campaign overviews, integrating data visuals that track ROI. Compatible with analytics tools, it supports embedded charts for live insights, or custom icons for thematic reinforcement.
Crafting Compelling Business Narratives Step by Step
- Pick a model slide: Choose based on your framework, like canvas for overviews.
- Fill in components: Add text and data to populate sections accurately.
- Incorporate 3D: Enhance with dimensional effects for visual interest.
- Refine aesthetics: Align colors and styles to your brand guidelines.
- Simulate delivery: Practice transitions to polish the flow.
- Engage audiences: Use in pitches or reports for maximum impact.
This process, echoing lean startup methodologies, turns presentations into strategic assets.
Outpacing Conventional Business Tools
Basic PowerPoint lacks the pre-integrated 3D and model sophistication here, often resulting in bland outputs. This template accelerates creation with ready frameworks, allowing focus on innovation. For data-driven roles, it means richer visualizations that foster better discussions. Seamless Google Slides import and cross-version support enhance team collaboration.
Proven Tips for Business Infographics
- Balance elements: Pair 3D with text to avoid visual clutter.
- Highlight key models: Use spotlights on critical business areas.
- Adapt for audiences: Simplify for execs, detail for teams.
- Integrate storytelling: Weave models into a cohesive journey.
- Track effectiveness: Analyze post-presentation metrics for refinements.
Inspired by design gurus at Harvard Business Review, these tactics amplify your message's reach.
This template isn't just about slides - it's about sparking business transformations through visuals. From ideation to execution, it supports your ambitions. Embrace the power of polished presentations - download the Business Infographic PowerPoint Charts template now and propel your ideas forward.
FAQ
How flexible are the business model slides?
Highly adaptable, with resizable sections and editable content for any framework.
Do 3D elements require special software?
No, all handled within PowerPoint for easy manipulation.
Can I collaborate on this template?
Yes, share via OneDrive or Google Slides for real-time edits.
Ideal for startup pitches?
Perfect, with models that structure narratives compellingly.
Are updates available?
Download includes access to future enhancements.
What resolution for 3D charts?
HD vectors ensure clarity at any scale.