3D Structure Keynote Charts - Fully Editable | ImagineLayout


What's Inside the Download
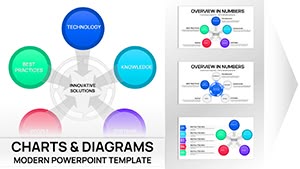
The download delivers a single .key file containing 23 editable slides.
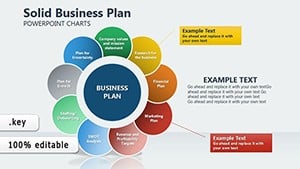
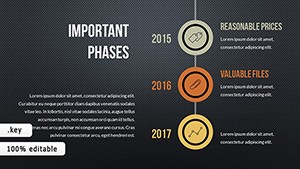
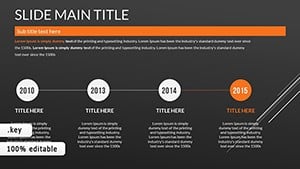
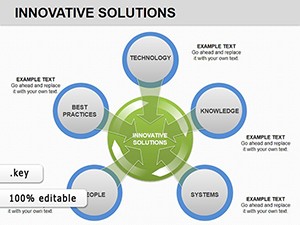
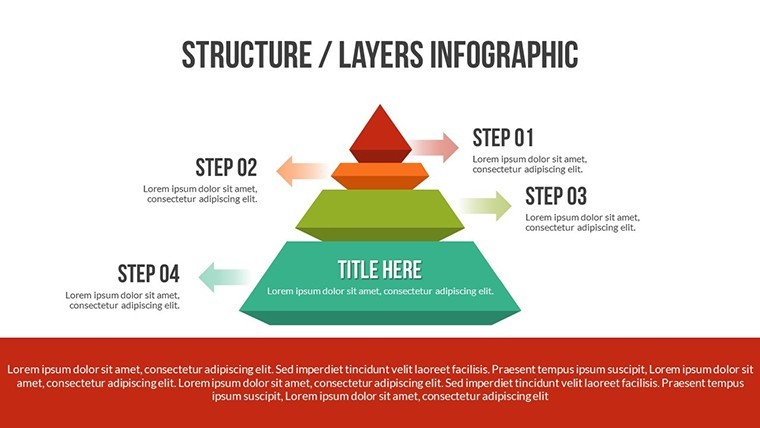
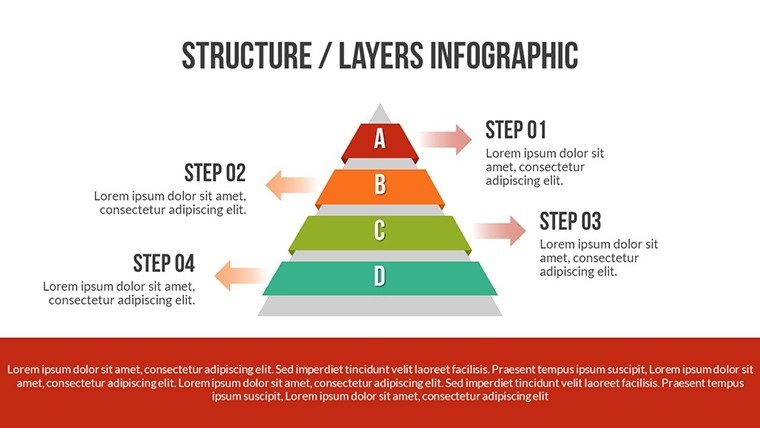
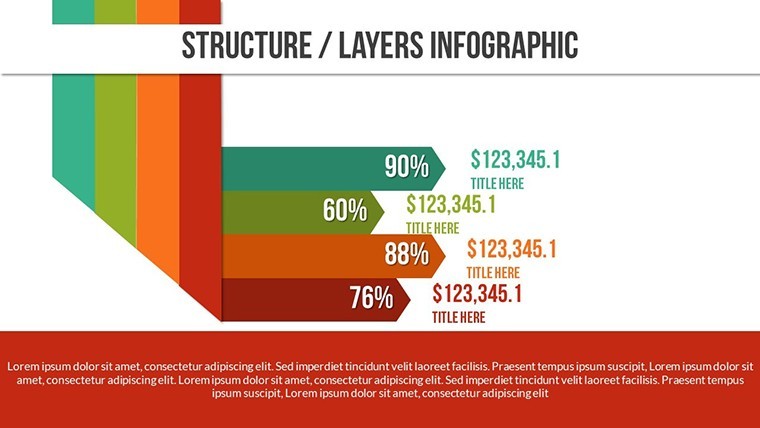
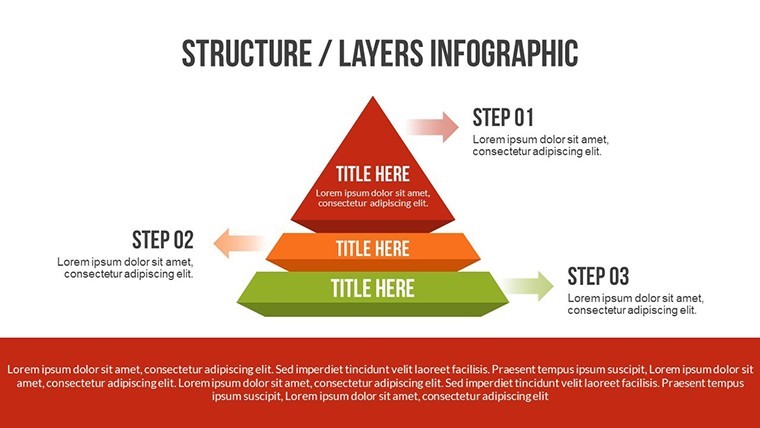
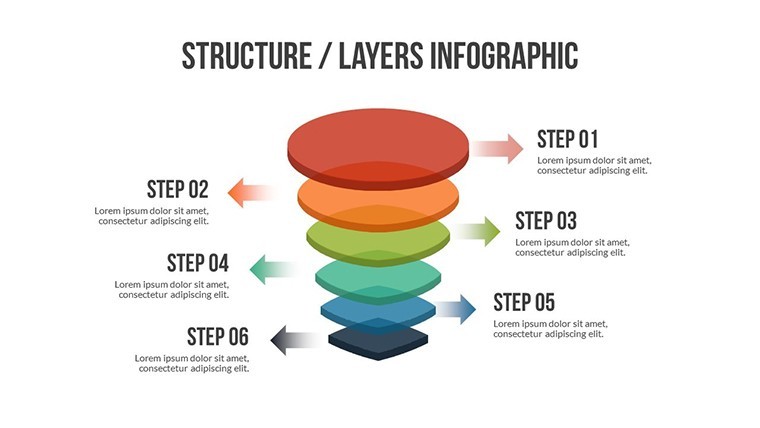
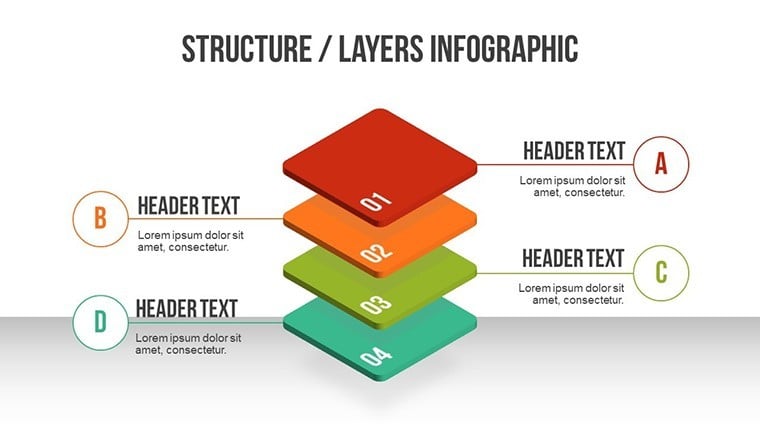
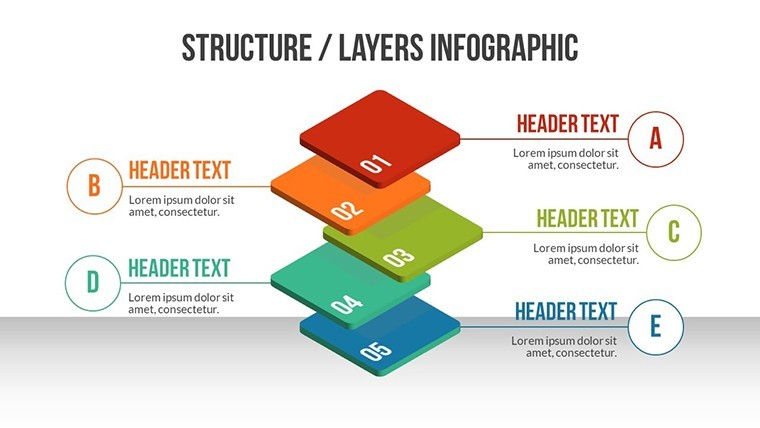
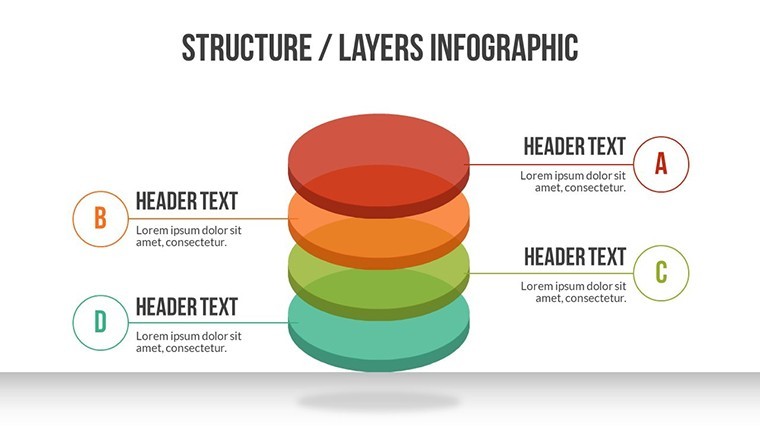
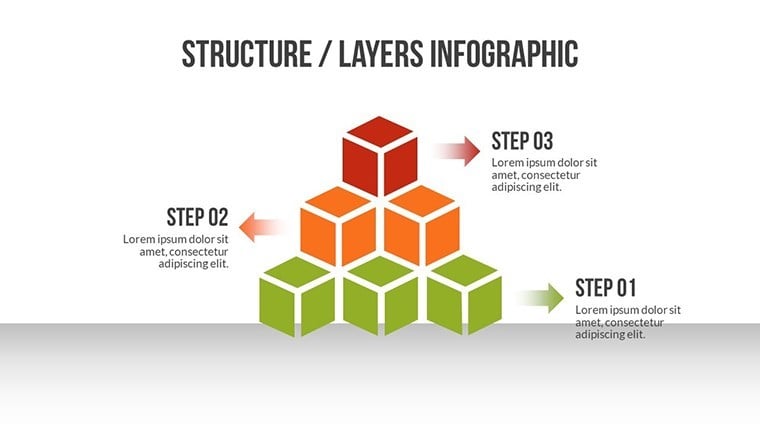
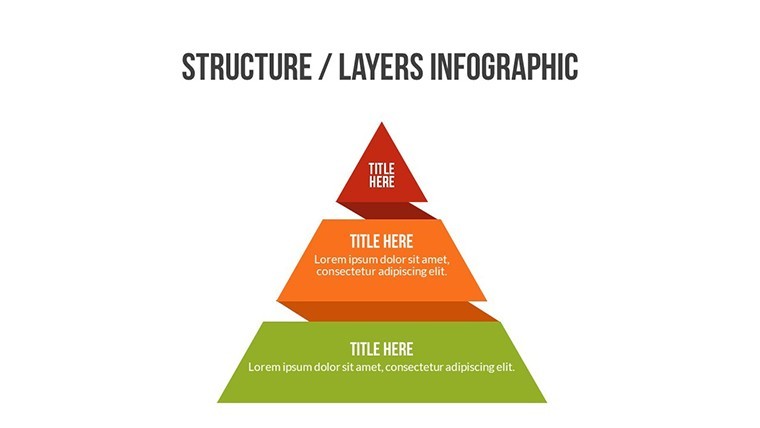
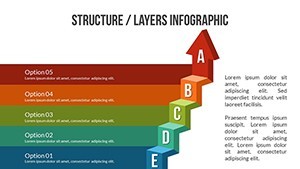
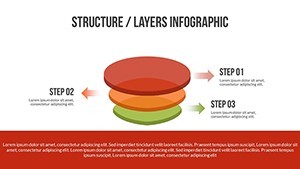
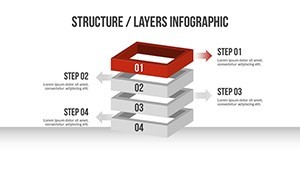
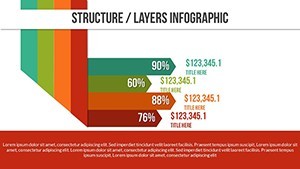
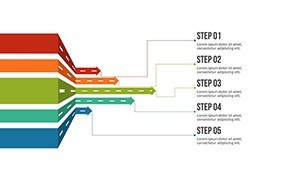
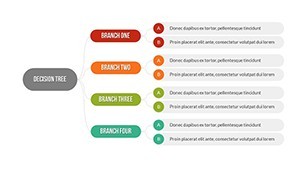
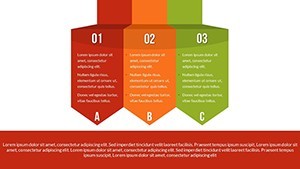
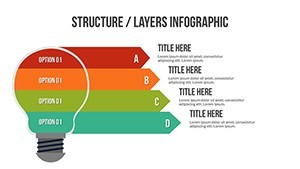
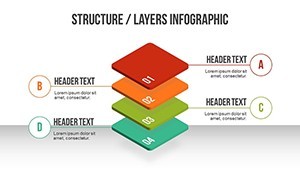
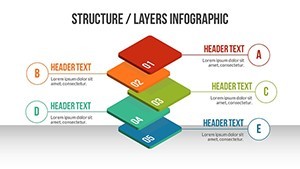
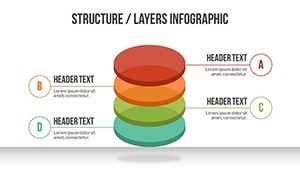
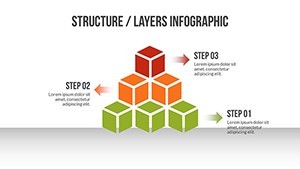
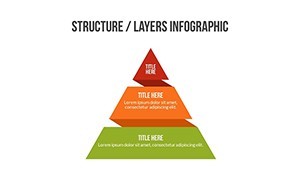
Slides feature 3D arrows and analytical tools that map hierarchies and workflows in one package.
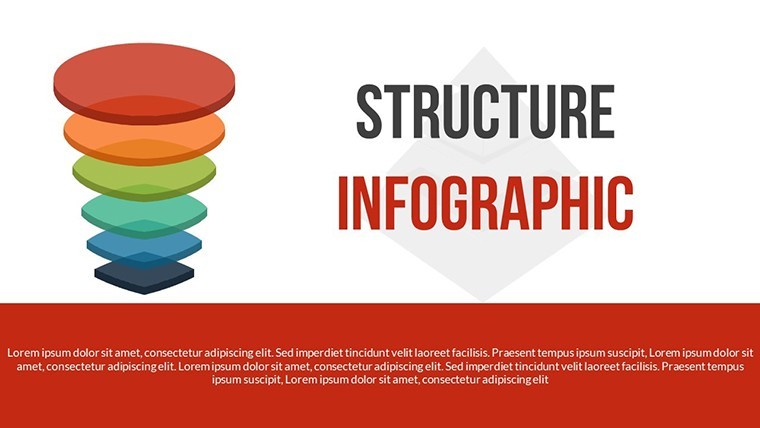
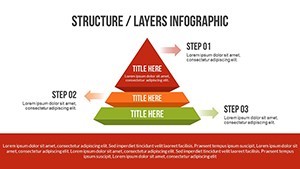
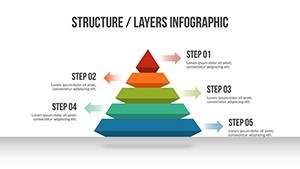
Compared to flat process sets, this one adds depth with 3D elements that enhance layout composition and make structures stand out in client proposals.
At a Glance
| Feature | Details |
|---|---|
| Slides included | 23 fully editable 3D diagrams |
| Diagram categories | arrows and hierarchy analysis |
| Editable elements | 3D shapes rotate and recolor |
| Aspect ratio | standard 16:9 |
| PowerPoint compatibility | Keynote only |
| Color themes | adjustable in format pane |
Adapting the Template to Your Brand
Moderate skill users finish in under 12 minutes.
- Open the .key file in Keynote (1 minute).
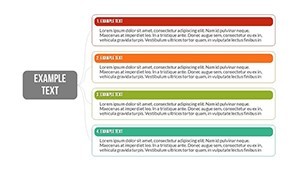
- Replace text placeholders (3 minutes).
- Adjust 3D depth and colors (4 minutes).
- Export PDF (1 minute).
Project managers often pair this with a 3D analysis Keynote template for larger client work.
Download now and build your next proposal deck.
Typical Use Cases by Role
Project Manager in Tech
A project manager maps organizational hierarchies during quarterly reviews. The outcome reuses the file across three reports after color swaps.
Analyst in Consulting
Analysts dissect workflows for client proposals and cut preparation time dramatically.
Building From Scratch vs. Starting Here
Manual 3D creation takes hours and risks misaligned depth. Ready slides save time and maintain consistent information spacing.
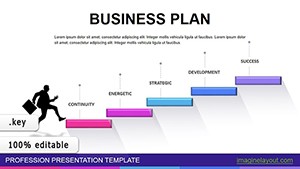
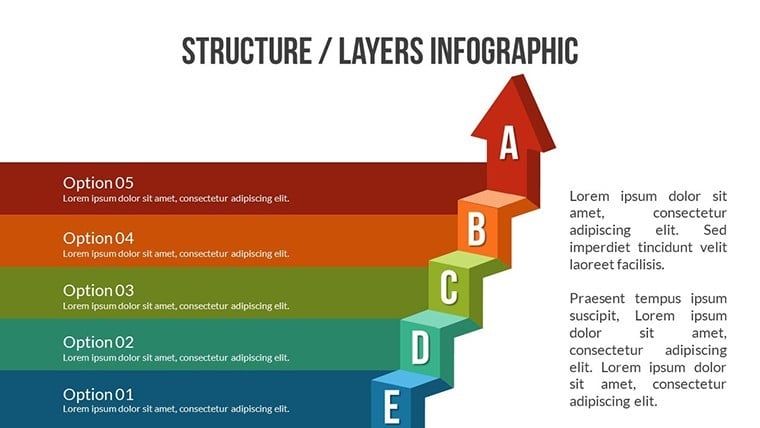
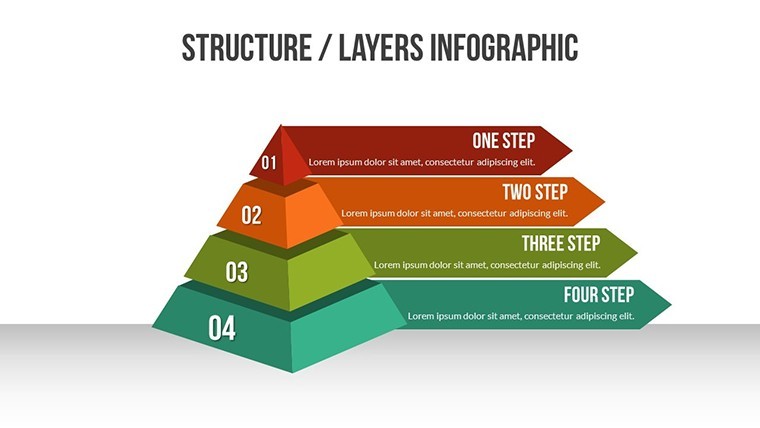
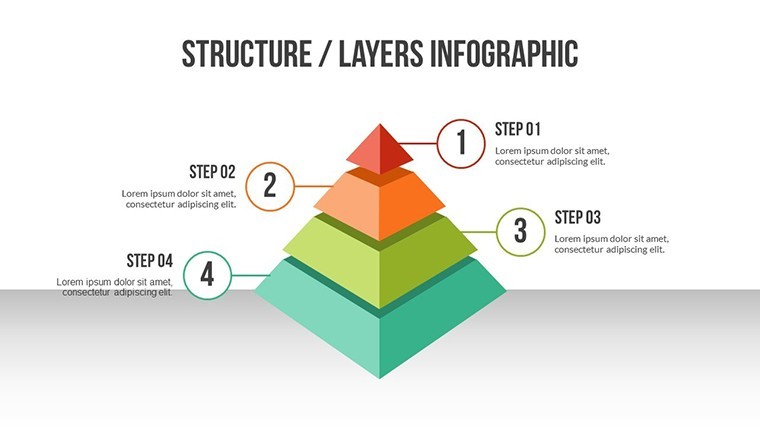
3D arrows point with adjustable perspective. This approach improves readability on projection screens during live meetings.
Get the download and start presenting with depth.
Which Keynote versions does this template support?
The file opens perfectly in Keynote 12 and newer on macOS. Older versions may need an update to unlock all editable layers. Open the .key file from Downloads to test compatibility right away. Keynote's repair tools fix most version issues in seconds.
How do I change the color scheme in Keynote?
Select any shape or arrow then open the format pane on the right. Pick a new fill color or apply a preset theme to all slides at once. The slide master updates connected elements automatically. Save a custom palette for future decks in under two minutes.
What does the license allow for client work?
You may use the slides in paid client presentations and consulting decks. The license covers commercial projects but prohibits resale or redistribution of the original .key file. Modify content freely for each engagement. Sublicensing the template itself remains forbidden.
How does the paid version differ from the free version?
The paid version unlocks the complete 23 editable slides without watermarks. Free previews offer only three sample diagrams with locked layers. Paid buyers receive full icon layers and connector adjustments. This difference saves hours when building complete process decks.
What software is required and what formats are included?
Apple Keynote on macOS is required to open the .key file. No other formats ship with the download. Export options include PDF and images after editing. The single file structure keeps everything organized in one place.
What is the refund policy?
Refunds are available within 30 days if the file fails to open in supported Keynote versions. Contact support with your order details and a screenshot of the issue. Approved cases process within 48 hours. Technical support remains available before any refund request.