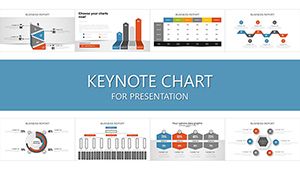
Animated Keynote Charts: Dynamic Presentations


Presentations don't have to be daunting; they can be as straightforward as drafting a document. Our Animations Presentation Keynote charts template demystifies the process for novices and pros alike, offering 17 editable slides focused on matrix, graphs, 3D, and arrows. Ideal for business analysts, educators, and project managers, this template turns raw data into animated masterpieces that engage and inform. Envision leading a strategy session where 3D graphs rotate to unveil hidden trends, or arrows guide viewers through process flows with seamless animations. Rooted in user-friendly design principles similar to those in Microsoft's intuitive tools, it bridges the gap for those transitioning from Word to advanced visuals. Benefits include time savings, enhanced clarity, and audience retention – perfect for sales pitches, training modules, or academic lectures. By incorporating animations, you elevate static content to interactive experiences, aligning with modern presentation trends from platforms like TED, where visuals amplify messages for maximum impact.
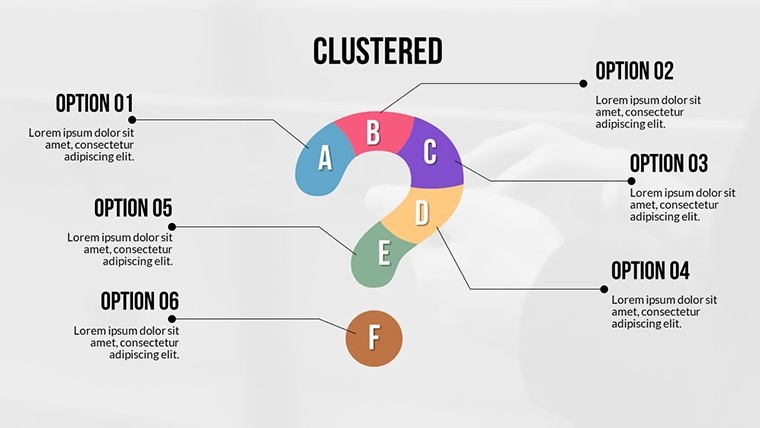
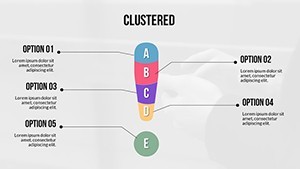
Exploring Animation-Driven Features
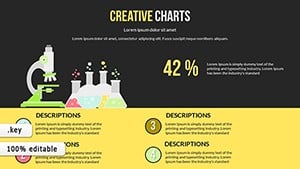
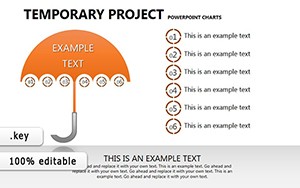
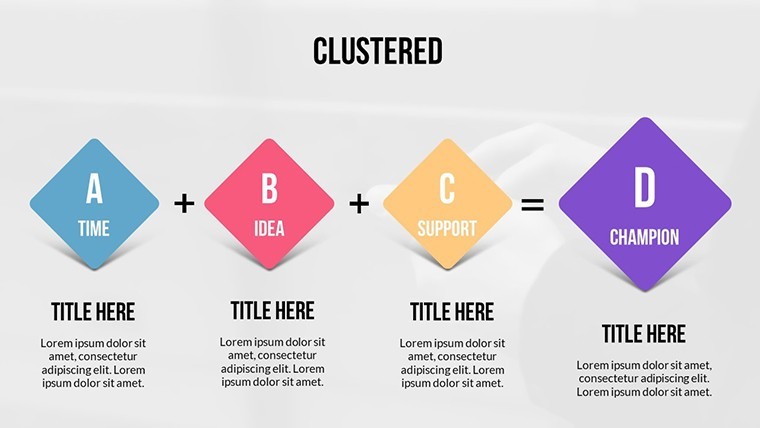
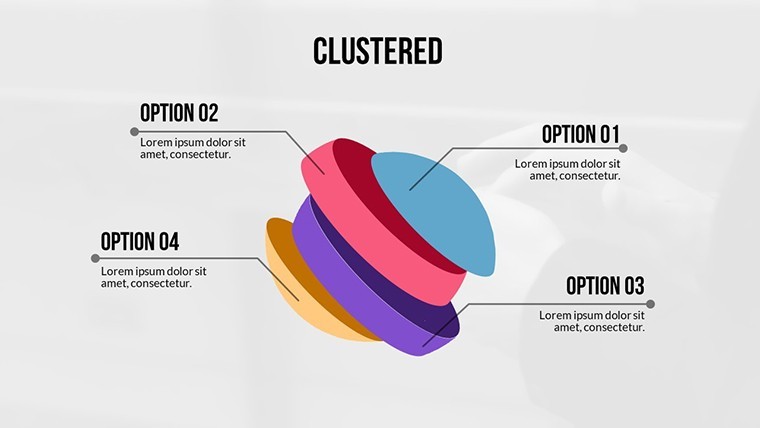
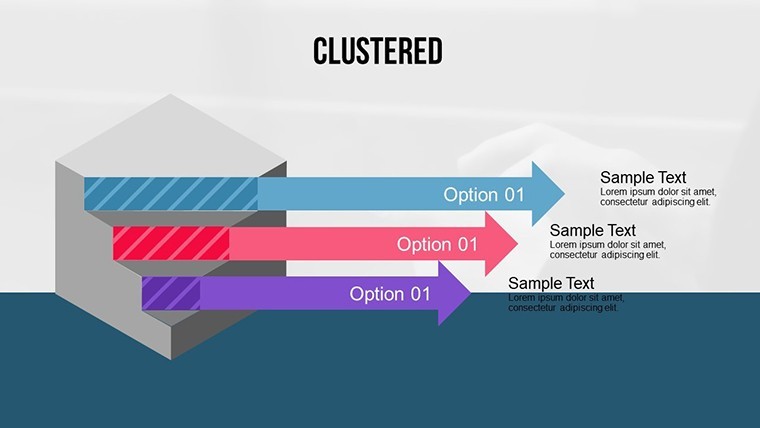
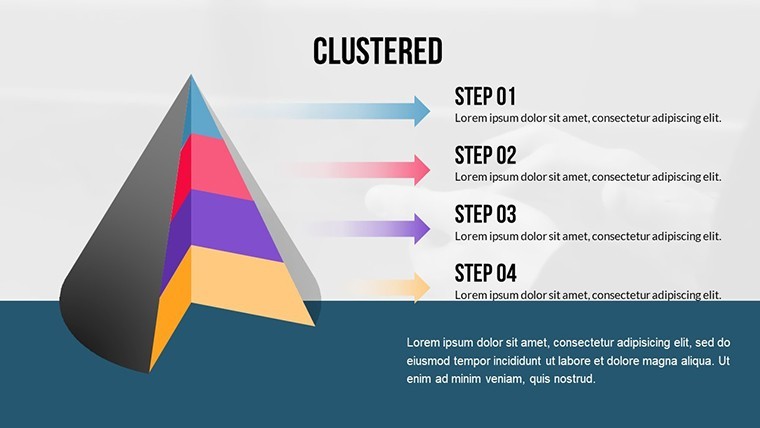
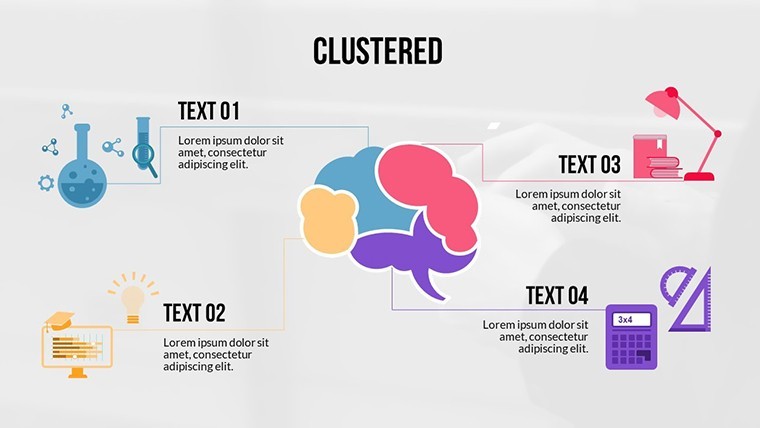
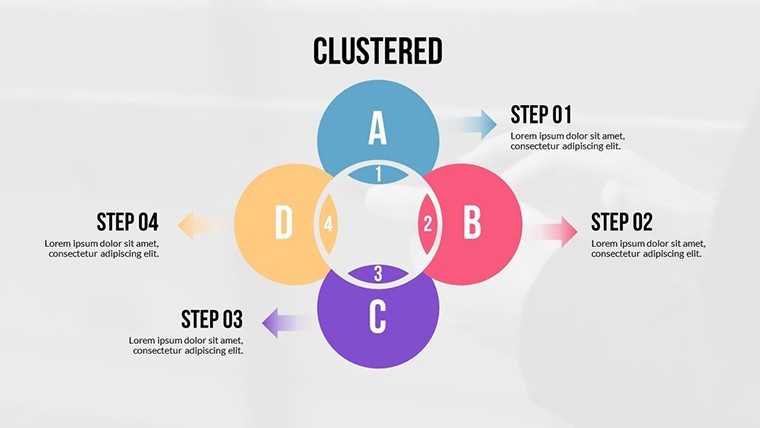
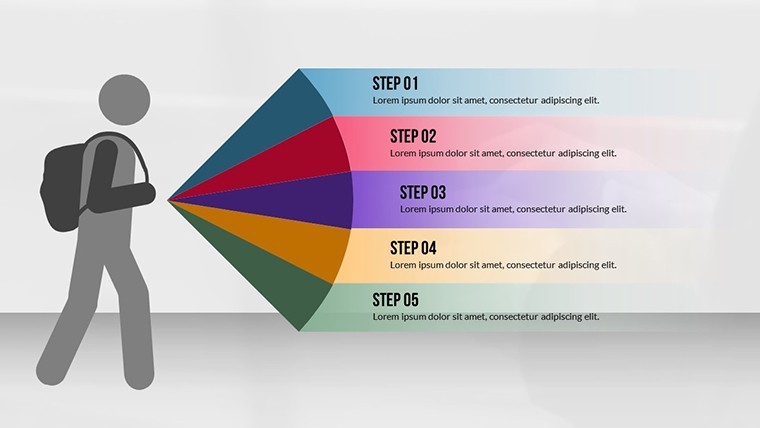
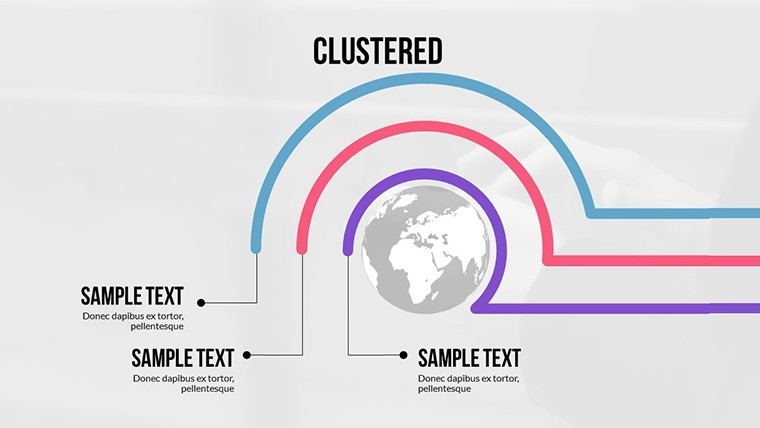
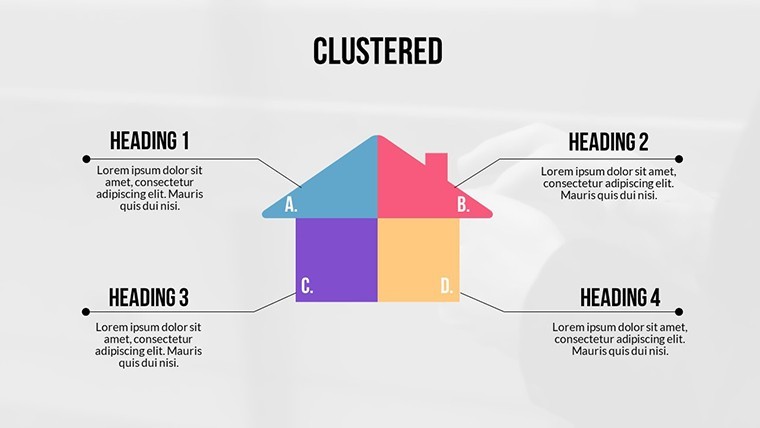
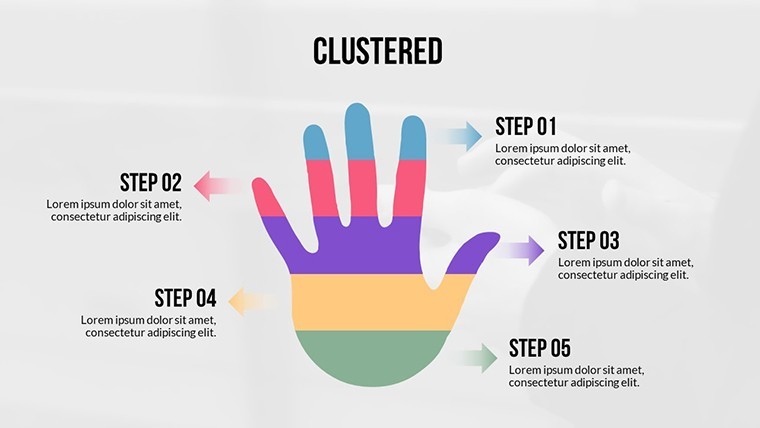
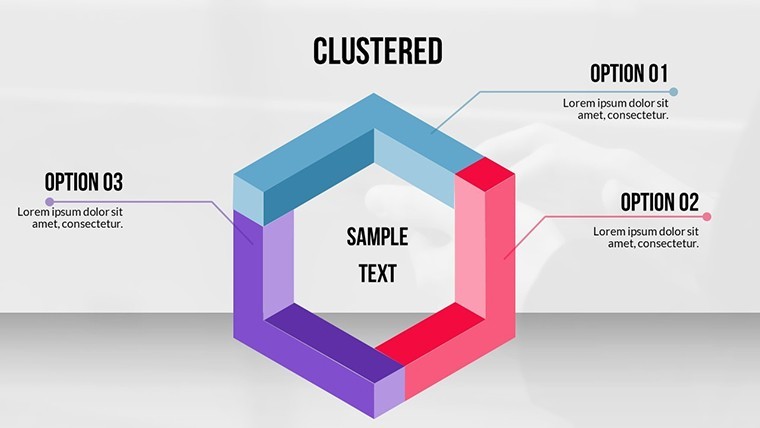
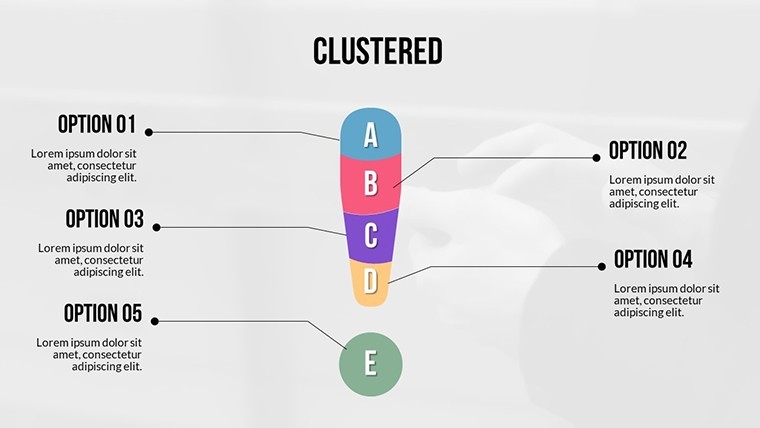
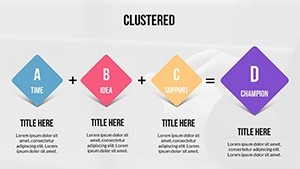
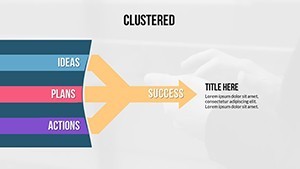
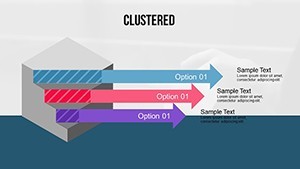
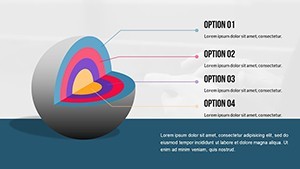
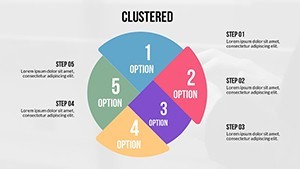
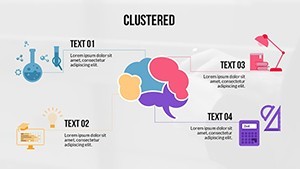
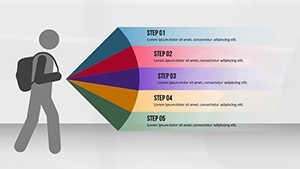
This template's strength lies in its animated capabilities across 17 slides. Matrix charts organize data in grids that animate cell by cell, ideal for comparative analyses. Graphs come alive with rising bars or curving lines, emphasizing growth patterns. 3D elements add depth, rotatable for multi-angle views, while arrows direct focus with motion paths. Everything is editable – adjust scales, colors, or add labels effortlessly. For a project manager, an arrow-infused flowchart can animate steps in a workflow, clarifying dependencies. This goes beyond basic charts by integrating motion, reducing misinterpretation and boosting engagement. Drawing from animation best practices in tools like Prezi, it ensures smoothness without distraction. The .key format guarantees Mac compatibility, with options to tweak for personal style. In essence, these features empower you to create presentations that feel alive, fostering better communication in professional environments.
Dynamic Applications in Everyday Scenarios
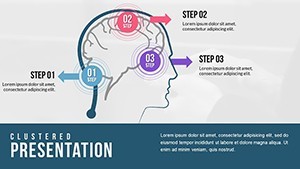
Apply this template dynamically across fields. In academia, educators use 3D graphs to teach statistics, animating data points for step-by-step understanding. Business teams might deploy matrix slides for SWOT evaluations, with animations revealing strengths first for dramatic effect. For tech demos, arrows guide through user interfaces, simulating navigation. A case study: consider a healthcare professional presenting treatment pathways; animated arrows trace patient journeys, making complex info accessible. Sales reps can animate sales funnels in graphs, showing conversion rates build up. In workshops, 3D visuals model concepts like molecular structures for science trainers. This adaptability mirrors successful uses in corporate reports, where visuals from firms like McKinsey emphasize key insights. By tailoring animations, you address specific audience needs, turning presentations into memorable events.
Animating Your Way: Step-by-Step Customization
- Import into Keynote: Load the template and browse the 17 slides.
- Input data: Enter values into graphs or matrices via simple text edits.
- Apply animations: Use the Animate pane to add builds, transitions, or paths to elements.
- Customize visuals: Change arrow directions, graph colors, or 3D perspectives.
- Add media: Incorporate images or videos to complement animations.
- Rehearse timing: Adjust delays for synchronized reveals.
- Present confidently: Run in slideshow mode to see dynamics in action.
This guide simplifies animation, making it accessible even if you're new, outperforming static alternatives by adding interactivity.
Building Trust with Professional Animations
Trust in this template's professionalism stems from its clean, modern design. Arrows provide directional cues, matrices structure thoughts, graphs quantify success, and 3D adds sophistication. In consulting, animate client progress reports for emphasis. Educators note higher student engagement with motion. Subtle CTAs, like animated "Next Steps" arrows, prompt responses. Aligned with visualization experts like Nancy Duarte, it avoids overload, focusing on message enhancement. For remote teams, animations maintain attention in virtual meetings. Overall, it's a reliable tool for polished outputs.
Launch Your Animated Journey Now
Embrace this Animations Presentation Keynote charts template for its 17 versatile slides. Integrate with data sources, customize deeply, and deliver standout presentations. Whether for pitches or teachings, it transforms ideas. Start animating today!
Frequently Asked Questions
- How simple is it to add animations?
- As easy as Word – select elements and apply from Keynote's menu.
- What chart types are animated?
- Matrix, graphs, 3D models, and arrows, all customizable.
- Compatible with older Keynote versions?
- Yes, works on recent Mac Keynote editions.
- Can I export animated slides?
- Export to video or PDF, though animations best in native Keynote.
- Suitable for large audiences?
- Absolutely, high-res and smooth for projections.