Keynote 3D Pie Chart Template - Fully Editable | ImagineLayout


32 Charts Across Multiple Layouts: Full Contents
32 editable slides arrive in KEY format.
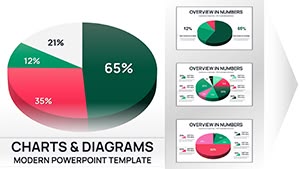
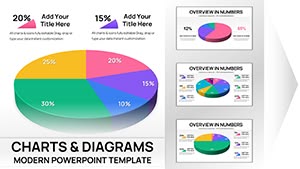
These 3D pie charts combine into layouts that support board meeting analysis by offering different composition options for single proportions or side-by-side comparisons.
This template stands out with its 32-slide collection dedicated to 3D pie chart variations explicitly built for board meeting data presentations unlike the more general or stylized pie chart packs in similar offerings.
What is a Keynote diagram template? A Keynote diagram template is a pre-designed KEY file with editable chart elements that open directly in Apple Keynote and allow quick customization for business presentations.
One specific visual characteristic is the 3D extrusion with depth shading on pie segments that conveys data proportions through volume.
- Single pie chart slides for focused data points
- Multi-pie comparison layouts for trend analysis
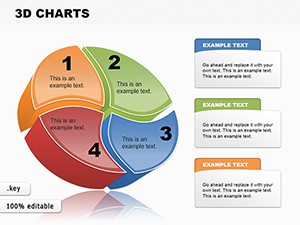
- Breakdown variations with segment callouts
Editing Capabilities at a Glance
| Feature | Details |
|---|---|
| Editable shapes | pie segments resize and recolor independently |
| Text placeholders | labels update without unlocking grouped elements |
| Color theme adjustments | compatible with Keynote slide master palette |
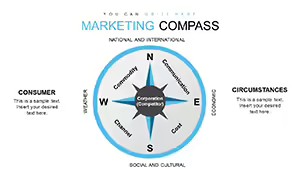
| Diagram connectors | arrows and lines adjustable in direction and weight |
| Export options | KEY for editing, PDF for distribution |
| Keynote compatibility versions | Keynote 12 or later on macOS |
Real Scenarios
Three hours before the board meeting the slide deck still lacked clear proportion visuals for the revenue breakdown.
The financial analyst at a multinational corporation faced the task of presenting market share data to executives with no time to build charts manually.
Using this file cut deck preparation from 3 hours to 45 minutes with all diagrams consistent across the presentation.
Download and start editing immediately
Adapting the Template to Your Brand
Open the file and spend the first two minutes orienting to the master slide structure - this is where all color changes happen globally.
The most common mistake is editing individual slide colors directly; going through the master saves 15 minutes of repeated work.
Once content is in place the export step depends on the destination audience and format needed for the meeting while individual overrides work independently for any last-minute tweaks.
Editing difficulty is moderate.
- Global color update via master
- Segment data swap in two clicks
- Layout rearrangement with drag-and-drop
Why This Template, Not a Blank Slide
Building equivalent 3D pie charts from scratch takes at least two hours and requires advanced design skills in Keynote.
What typically goes wrong includes inconsistent segment alignment and missing depth effects that reduce visual hierarchy during live discussions.
The 3D extrusion in pie charts allows segments to appear with realistic volume making small percentage slices stand out against larger ones through depth rather than just color alone - this pre-attentive cue helps board members grasp relative sizes during fast-paced discussions without needing to read every label first.
For additional 3D options explore similar chart collections or check related data visualization sets.
Teams that need more variety can explore the full range of pie Keynote charts templates.
Download and start editing immediately
Which Keynote version is required?
This template opens in Keynote 12 or later on macOS. Earlier versions may not support all 3D effects or advanced shape editing features fully. Test the file in your current version before the meeting to confirm full compatibility. Update Keynote if needed for optimal results with the 3D pie elements.
How do I change the color scheme?
Open the slide master view in Keynote and adjust the theme colors there for global updates across all 32 slides. Individual segment overrides remain possible by selecting a single shape and applying a custom fill. This approach ensures brand consistency without editing every pie chart manually. Save the master changes before returning to normal view.
What does the license allow?
The license permits use in internal company presentations and paid client work. You may not resell or redistribute the original KEY file as a standalone product. Multiple team members can use the file under the single purchase if they work for the same organization. Contact support for enterprise licensing questions.
What are the differences between free and paid versions?
The paid version includes the complete 32 editable slides in full KEY format. Free version details are not specified on page but typically offer only preview images or limited slides. The full paid file provides all layout variations and 3D effects without watermarks. Purchase unlocks immediate access to the complete package.
What is the refund policy?
Refunds are available within 14 days if the file does not open correctly in Keynote 12 or later. Provide proof of purchase and a description of the issue. No refunds after successful download and opening of the full 32-slide file. Contact support with your order number for any questions.
How do I update chart data?
Select any pie segment on the slide and edit the linked data values directly in the chart data editor. Labels and proportions update automatically with the 3D effects preserved. Repeat for every slide that needs changes. This process takes seconds per chart and keeps the layout intact.
How do I export the presentation?
Choose File then Export to PDF for distribution or to PowerPoint if the recipient uses Windows. The 3D effects convert correctly in most cases. Export individual slides as images if needed for web or email. Always test the exported file before the board meeting.