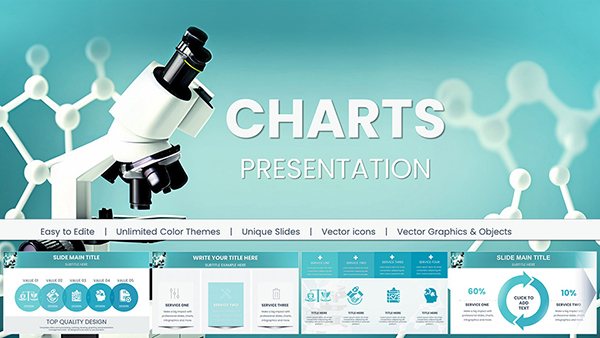
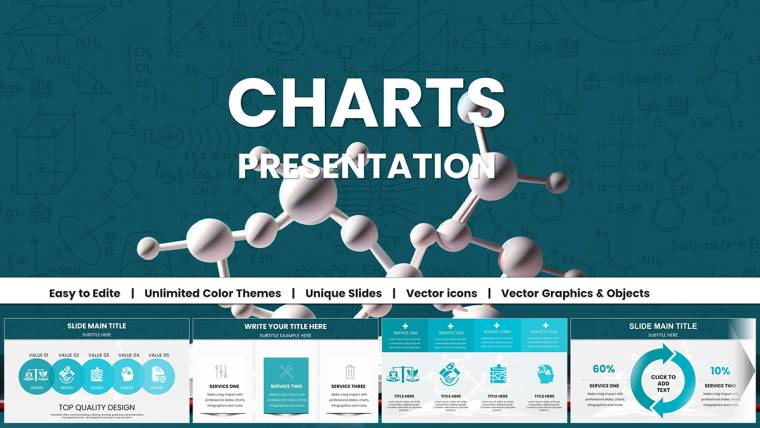
Chemical Charts Keynote Template - Fully Editable 47 Slides | Instant Download


Type: Keynote Charts template
Category: Relationship, Graphs, Illustrations
Sources Available: .key
Product ID: KC01062
Template incl.: 47 editable slides
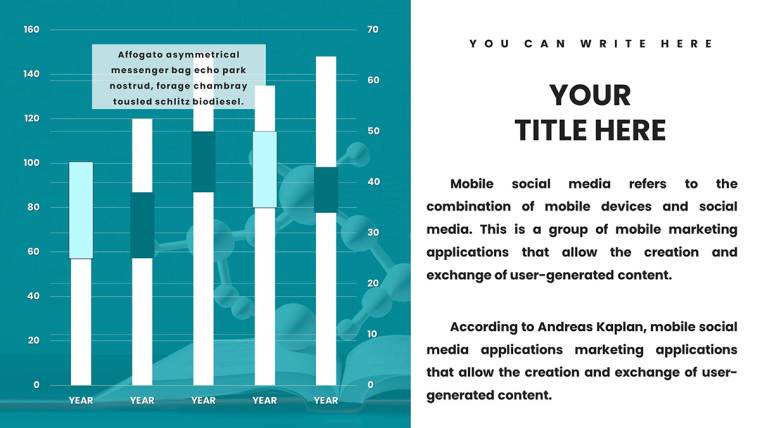
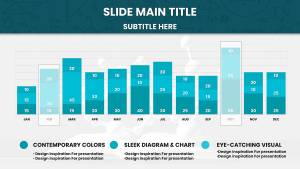
Download the Chemical and Biochemical Charts Keynote Template with 47 editable slides for educators and researchers. Present molecule structures, enzyme kinetics graphs, periodic tables and reaction pathways with academic clarity in native Keynote. Instant .key download optimized for STEM presentations.
What's Included
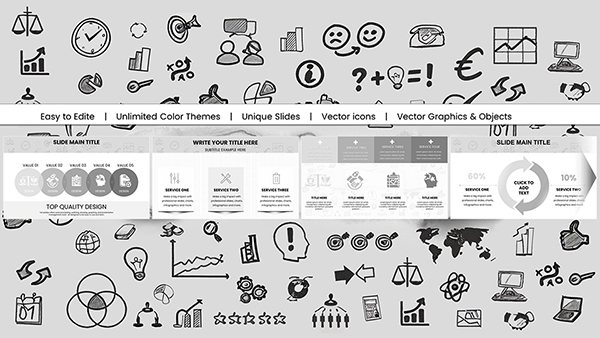
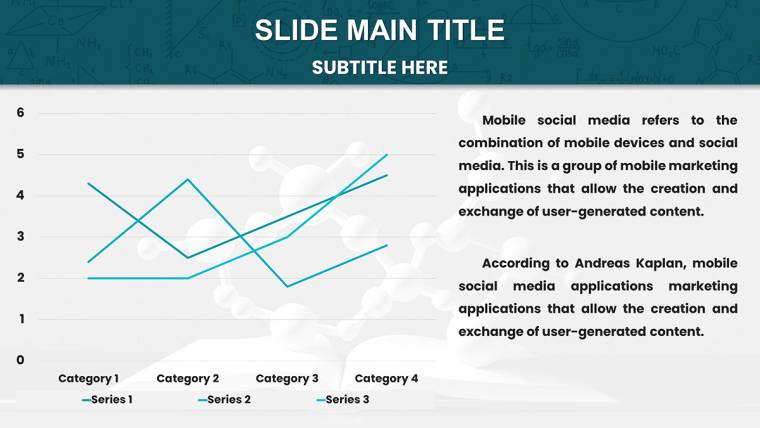
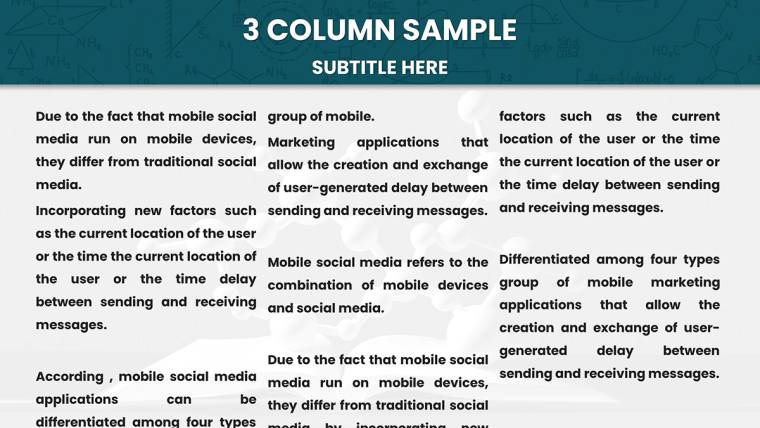
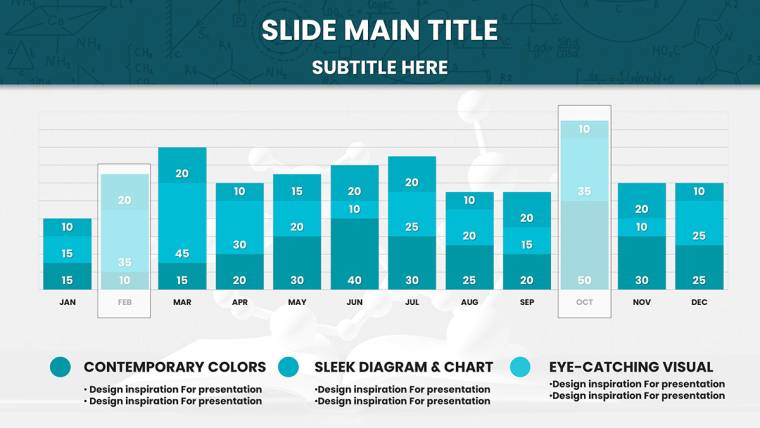
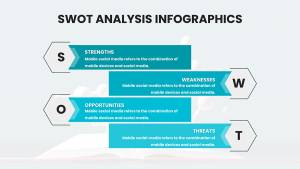
This Education Chemical and Biochemical Charts Template contains exactly 47 fully editable slides in native .key format built for chemistry and biochemistry teaching. Every slide features vector-based molecule diagrams, data graphs with adjustable curves, periodic table integrations, and lab process flowcharts with step-by-step placeholders. You receive dedicated layouts for structural formulas of compounds, reaction rate plots, pH level charts, isomerism infographics, enzyme-substrate kinetics curves, and cytochrome P450 pathway diagrams.
Core Slide Functions
Molecule structure slides allow rotation and bond highlighting while kinetics graphs include draggable data points that update trend lines automatically. Periodic table visuals support color-coding by element properties and lab process flows map sequential synthesis steps with editable beakers and test tube icons.
Key Features
The template follows a clean academic aesthetic with color-coded illustrations for organic compounds in greens and aqueous solutions in blues, aligned with American Chemical Society educational guidelines. All elements are vector and scale perfectly. Every diagram, graph axis, and text label can be modified directly inside Keynote without external software.
Editable Elements List
| Element | Customization Options |
|---|---|
| Molecule bonds | Add/remove bonds, recolor atoms |
| Kinetics curves | Drag data points, change line styles |
| Periodic table cells | Highlight elements, edit properties |
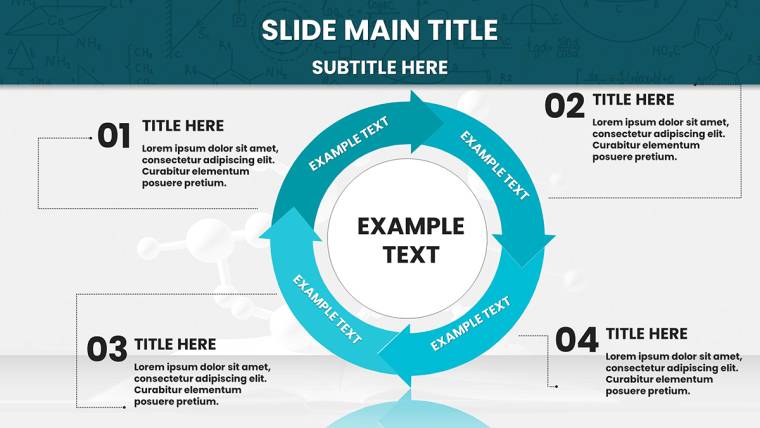
| Reaction arrows | Adjust direction, label reagents |
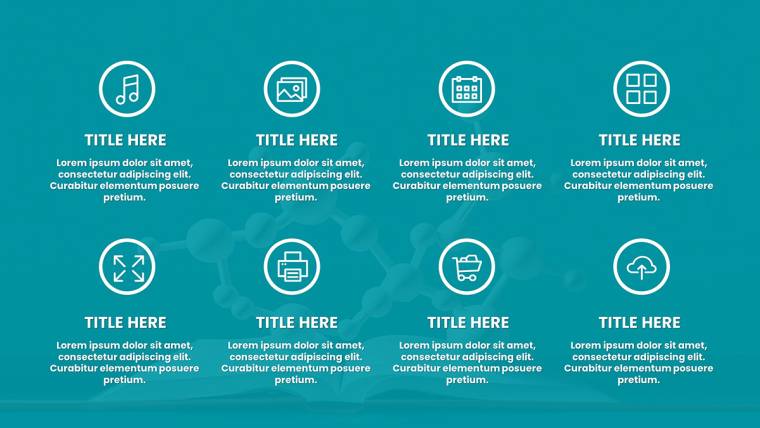
| Icon layers | Beakers, test tubes, bonds |
| Graph axes | Rescale units, update labels |
Professional Use Cases
A university professor teaching enzyme kinetics replaced placeholder data on the Michaelis-Menten curve slide with real lab results and used Keynote builds to reveal each parameter step-by-step during lecture. Students reported higher comprehension of abstract concepts. A high school chemistry teacher used the isomerism infographic slide to compare molecular structures side-by-side, allowing students to visualize differences instantly instead of drawing on the whiteboard.
Conference Presentation Scenario
Researchers presenting drug metabolism pathways at conferences use the cytochrome P450 reaction chart to highlight metabolic steps, swapping sample compounds for their specific molecules and exporting the deck for handout distribution with editable footnotes.
How to Customize
Download the .key file, open in Keynote, click any text placeholder or data point to update values, drag molecule atoms to new positions, and recolor bonds or graph lines using the format panel. Duplicate slides for additional examples and apply phased animations to reveal reaction steps sequentially. The entire deck remains perfectly aligned after edits.
Time-Saving Comparison
Creating publication-quality molecule diagrams and kinetics graphs from scratch in Keynote takes 10+ hours of precise alignment and testing. This template reduces setup to under 20 minutes because all vectors, curves, and layouts are pre-aligned to ACS visual standards.
Why Choose This Template
Unlike general educational or marketing chart packs in the related section, this template contains chemistry-specific molecule builders, enzyme curve presets, and periodic table integrations that no other product on the site provides. The 47-slide depth covers every core topic from structural formulas to bioinorganic pathways while remaining fully vector-editable.
Frequently Asked Questions
How do I edit the molecule diagrams?
Select any atom or bond in Keynote and drag to reposition or use the format panel to recolor. All 47 slides use vector elements so changes remain crisp at any zoom level. Text labels update by clicking placeholders and the layout stays balanced automatically.
Is the template compatible with other software?
The file is native Apple Keynote .key format and will not open correctly in PowerPoint or Google Slides. All vector scaling, graph updates, and animation builds are optimized exclusively for Keynote on Mac, iPad, or iCloud.
Can I use these charts in published research?
Yes, the editable diagrams are intended for both classroom and professional use. Customize and export slides as images or PDF for inclusion in papers or conference posters while retaining full academic clarity.
How many slides can I add or remove?
All 47 slides are independent. Duplicate any slide to create extra examples or delete unused ones. Vector elements and data placeholders remain fully functional on every copy.
What file will I download?
One complete .key file containing all 47 slides. No extra assets required. The download is instant after purchase and stays available in your account.