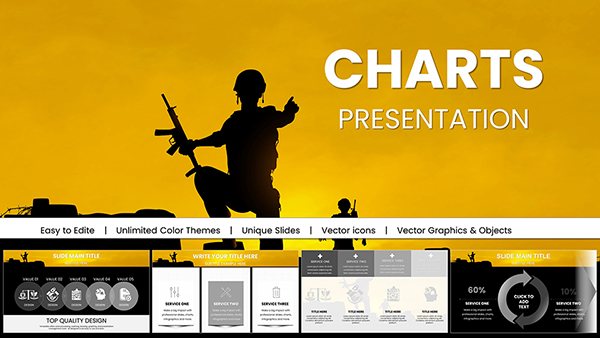
Editable Financial Charts Keynote Template: Transform Data into Impactful Stories


In the fast-paced world of finance, where numbers tell the tale of success or caution, presenting complex data clearly can make or break a deal. Imagine walking into a boardroom with a Keynote presentation that not only displays revenue trends and market shares but does so with sleek, professional visuals that captivate your audience. Our Editable Financial Charts Keynote Template is crafted precisely for finance professionals, business analysts, and consultants who need to convey strategic insights without the hassle of starting from scratch.
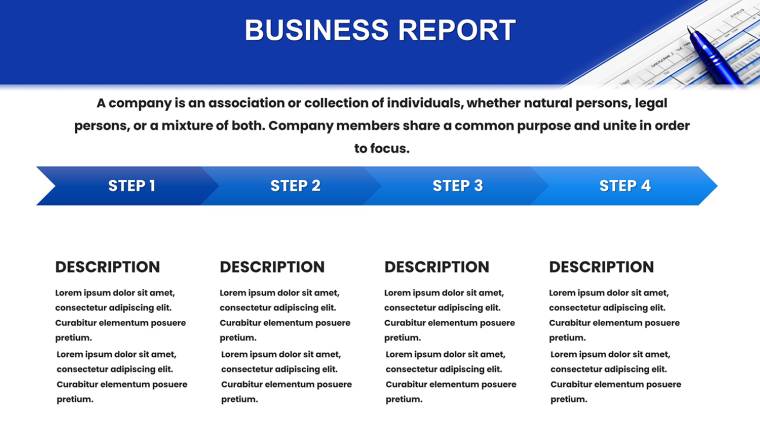
This comprehensive 45-slide toolkit is fully customizable, featuring a modern minimalist design that keeps the focus on your data. Whether you`re preparing a quarterly earnings report, pitching to investors, or analyzing market forecasts, these slides empower you to create compelling narratives. Compatible with Keynote on Mac, iPad, and iPhone, it supports widescreen 16:9 resolution for seamless viewing. Save hours on design - simply import your figures into placeholders and watch your presentation come alive with dynamic animations and brand-aligned colors.
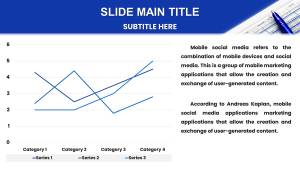
What sets this template apart is its depth: from bar charts breaking down profit margins to interactive KPI dashboards that highlight key performance indicators like ROI and EBITDA. We`ve drawn from real-world financial standards, such as GAAP-compliant visualizations, to ensure your slides resonate with stakeholders. For instance, a startup founder using these for an investor deck can effortlessly illustrate growth trajectories using line graphs, turning raw spreadsheets into persuasive stories that secure funding.
Unlocking the Power of Professional Financial Visuals
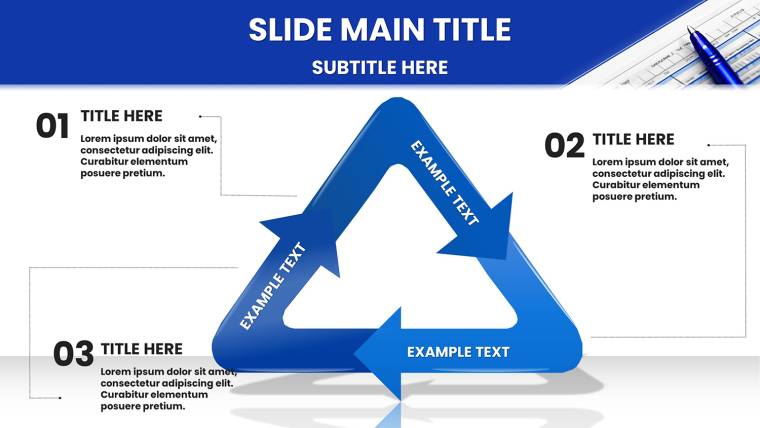
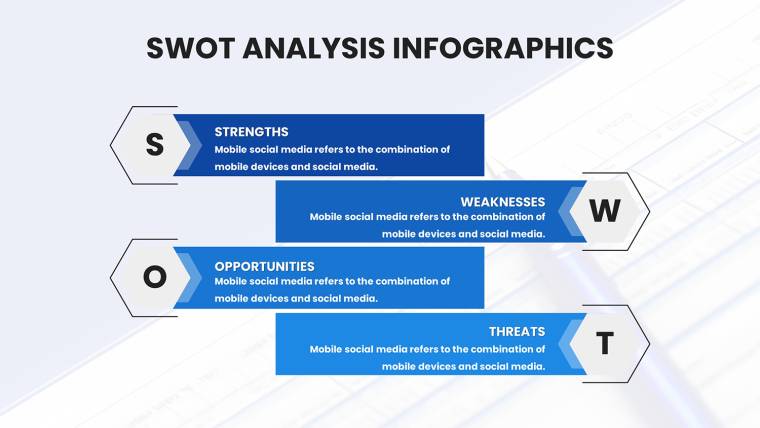
Dive deeper into why this template is a game-changer for your workflow. Traditional PowerPoint or basic Keynote charts often feel clunky and uninspired, but our template offers pre-built elements like pie charts for expense allocations and SWOT diagrams for risk assessments. These aren`t just generic shapes; they`re tailored for financial contexts, with icons representing currency, stocks, and economic indicators.
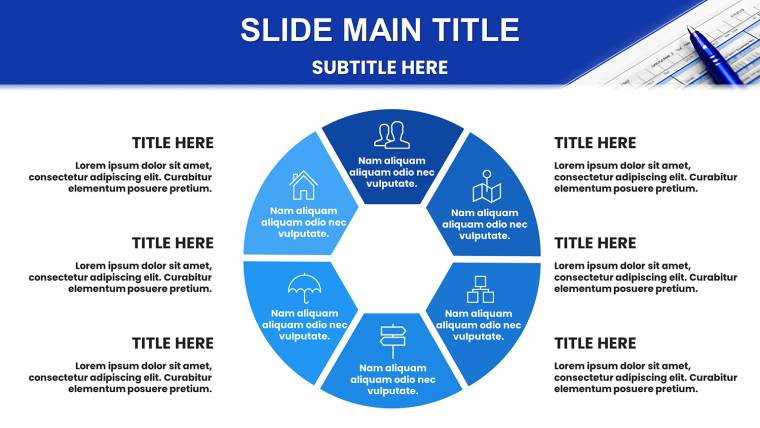
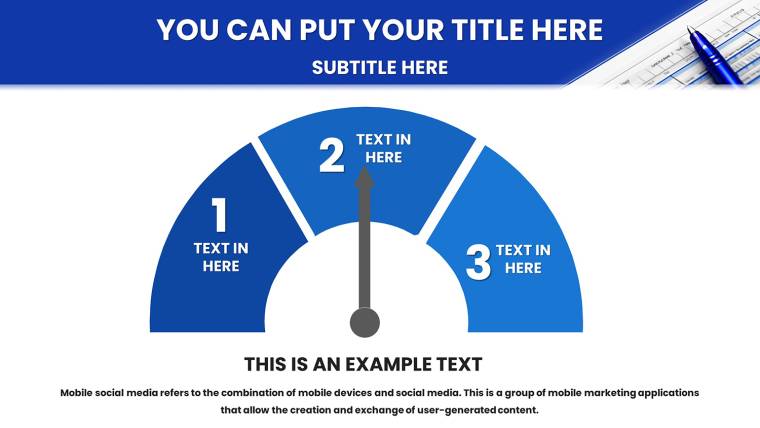
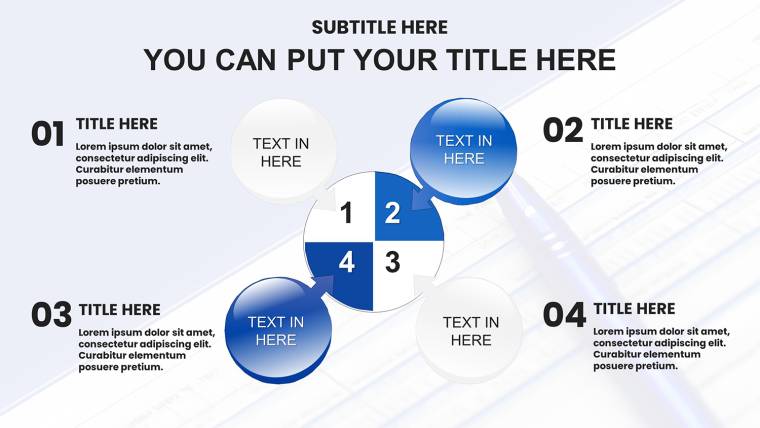
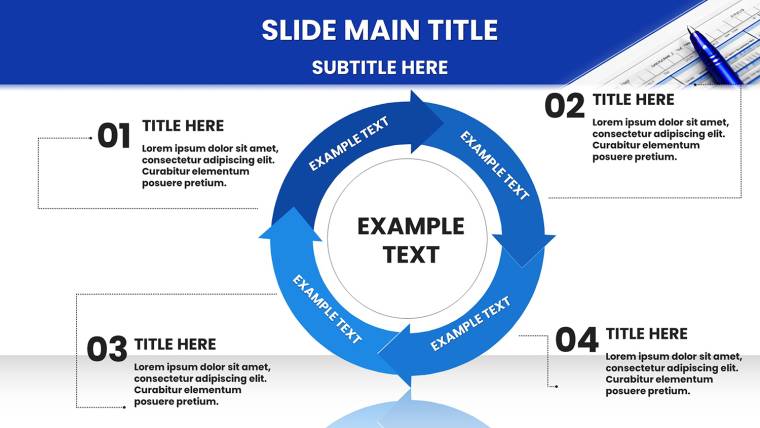
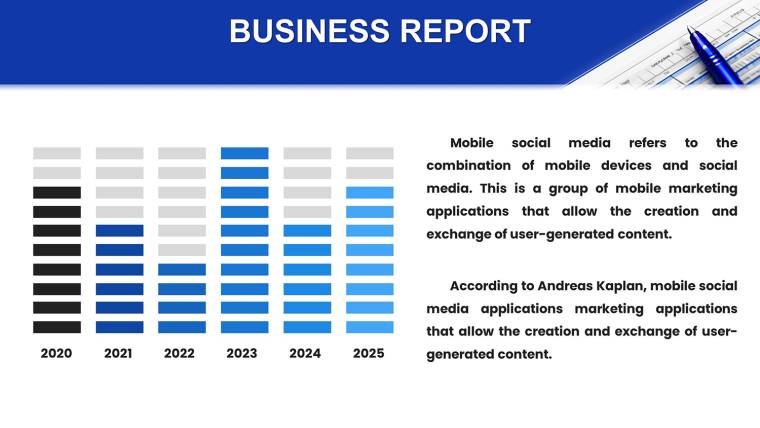
- Versatile Chart Library: 20+ chart types including radial gauges for debt ratios, funnel charts for sales pipelines, and heat maps for portfolio performance.
- Animation Mastery: Smooth transitions that reveal data progressively, keeping viewers engaged during long sessions.
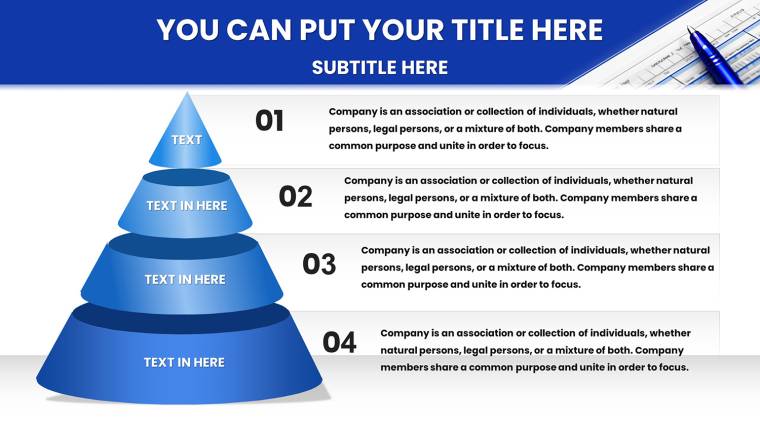
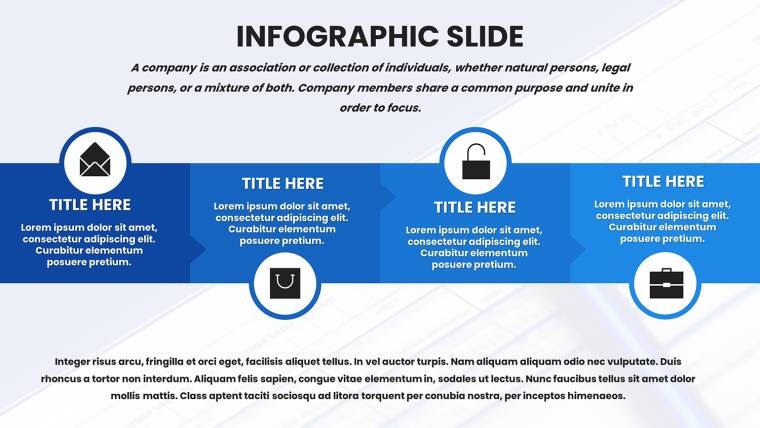
- Infographic Boost: Built-in elements for budget breakdowns and forecast timelines, complete with editable vectors for precision.
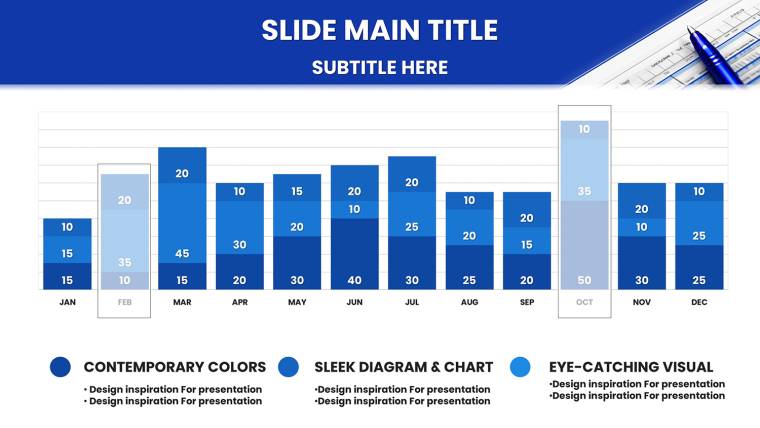
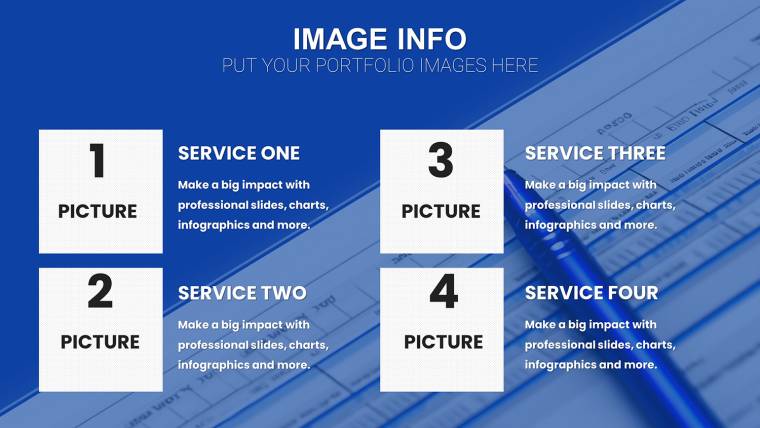
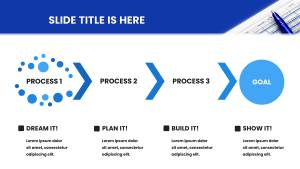
Consider a scenario in corporate finance: You`re tasked with presenting annual budgets to executives. Using slide 12`s clustered column chart, you can layer departmental spending side-by-side, color-coded to your company`s palette. This not only clarifies variances but also sparks discussions on reallocations - proving the template`s role in driving decisions.
Real-World Applications in Finance
Finance isn`t one-size-fits-all, so we`ve optimized this template for diverse scenarios. For investment bankers, slides 25-30 feature Gantt charts for project timelines in mergers and acquisitions, ensuring every milestone is visually tracked. Auditors will appreciate the compliance-focused tables on slide 35, which integrate checklists for regulatory adherence, inspired by SOX requirements.
In a case study from a mid-sized firm, analysts reported cutting preparation time by 60% when using similar customizable charts for client reports. This template replicates that efficiency, allowing you to focus on analysis rather than aesthetics. Pair it with tools like Excel for data import, and you`ve got a powerhouse for monthly variance reports or economic outlooks.
Customization Tips for Maximum Impact
Getting started is straightforward, but mastering customization elevates your presentations. Begin by duplicating slides to experiment - Keynote`s layer system makes it easy to tweak fonts to sans-serif options like Helvetica for readability. For color schemes, align with financial branding: blues for trust, greens for growth.
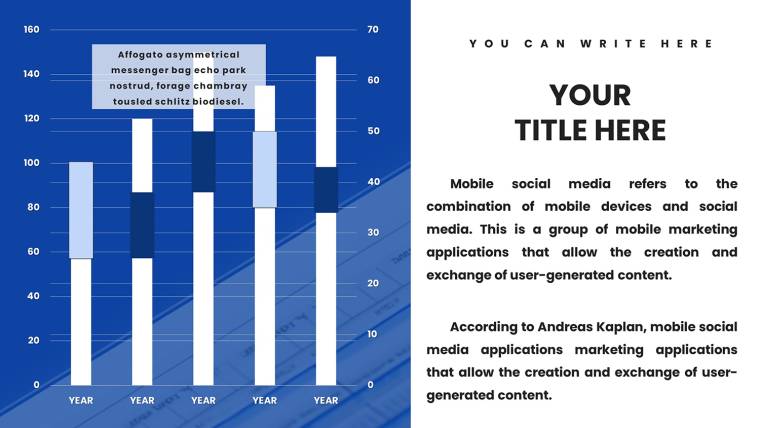
- Import Data Seamlessly: Use Keynote`s chart builder to pull from CSV files, updating pie slices for market shares instantly.
- Add Interactivity: Hyperlink charts to detailed appendices, guiding viewers through your financial model.
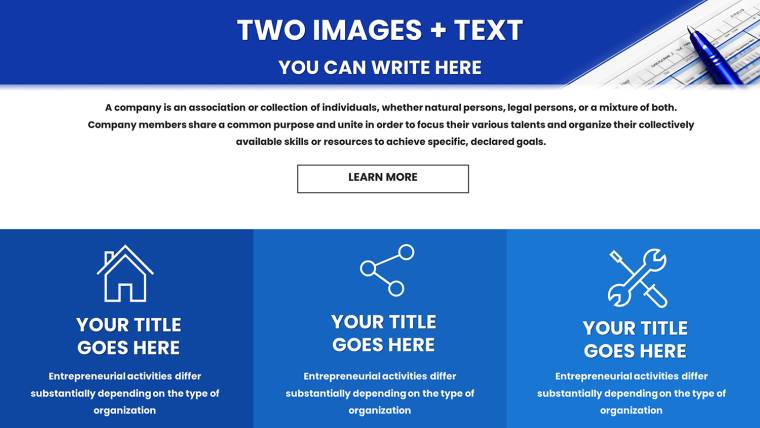
- Enhance with Icons: Our library includes 50+ finance-themed icons; resize and recolor them to fit any slide.
A pro tip: For high-stakes pitches, incorporate subtle animations on entry, like fading in bars to build suspense around revenue spikes. This technique, used in top-tier CFO presentations, keeps audiences hooked without overwhelming them.
Who Stands to Gain the Most?
This template shines for anyone handling financial narratives. CFOs crafting board updates, financial advisors illustrating portfolio diversifications, or even educators teaching MBA courses on quantitative analysis. Its flexibility extends to non-finance roles too - marketers analyzing ROI on campaigns or HR leads budgeting talent acquisition.
Unlike free online templates that lack polish, ours includes lifetime updates and a bonus guide on data storytelling, drawing from experts like Edward Tufte`s principles of graphical integrity. Ensure your visuals are trustworthy by avoiding chart junk; our clean designs inherently support this.
Why This Template Outperforms the Competition
In a sea of generic chart packs, our template excels with financial-specific innovations. While basic options might offer 10 slides, we deliver 45, covering everything from PESTLE analyses to balance sheet infographics. Compatibility isn`t an afterthought - export to PDF for sharing or PDF for archival, maintaining fidelity.
Users rave about the time savings: One consultant shared how it streamlined their quarterly reviews, impressing clients with visuals that rival agency work. Integrate it into your workflow alongside tools like Tableau for deeper insights, then polish in Keynote for that Apple-level sheen.
Ready to elevate your financial storytelling? Download the Editable Financial Charts Keynote Template today and turn spreadsheets into strategic masterpieces. Your next presentation deserves this edge - secure it now and watch your insights resonate.
Frequently Asked Questions
How editable are the charts in this Keynote template?
All 45 slides are fully editable, allowing you to modify data, colors, fonts, and layouts directly in Keynote without needing additional software.
Is this template compatible with PowerPoint?
While optimized for Keynote, you can export to PowerPoint format, though some animations may require minor adjustments.
What file formats are included?
The download provides .key files for Keynote, plus a PDF preview and the bonus data presentation guide in PDF.
Can I use this for commercial purposes?
Yes, it comes with a commercial license for professional use in reports, pitches, and client work.
Are there updates to the template?
Lifetime free updates ensure you get new features and chart types as we evolve the design.
How do I import my own data?
Use Keynote`s built-in chart tools or copy-paste from Excel; placeholders make it intuitive.