Business Funnel Keynote Charts - Fully Editable | ImagineLayout


Type: Keynote Charts template
Category: Free Templates, Flow
Sources Available: .key
Product ID: KC00627
Template incl.: 16 editable slides
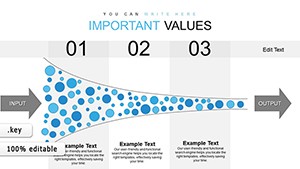
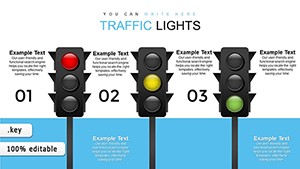
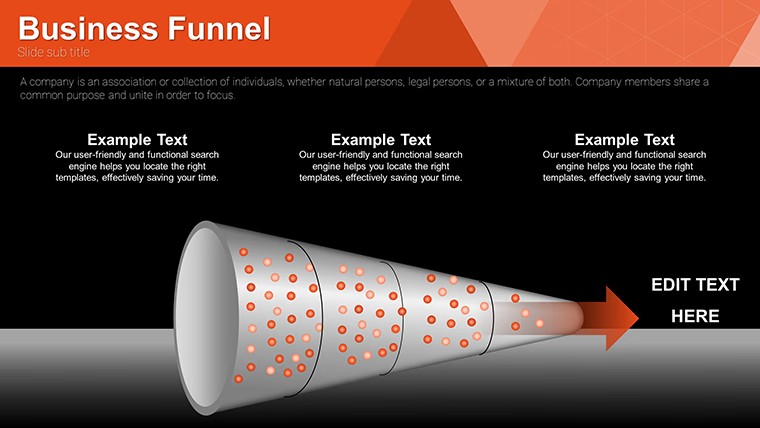
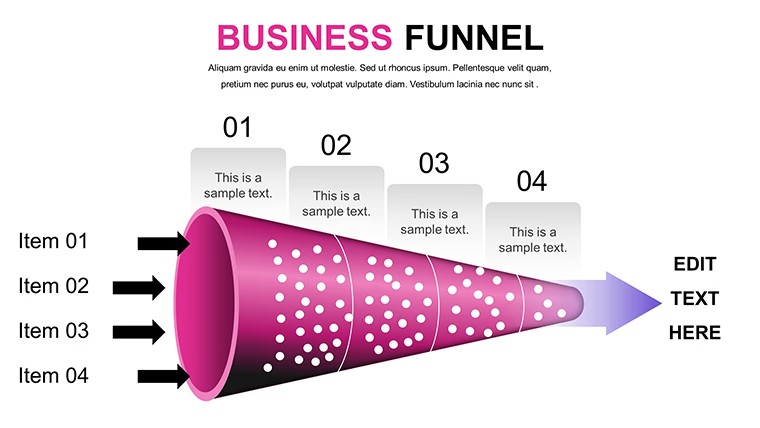
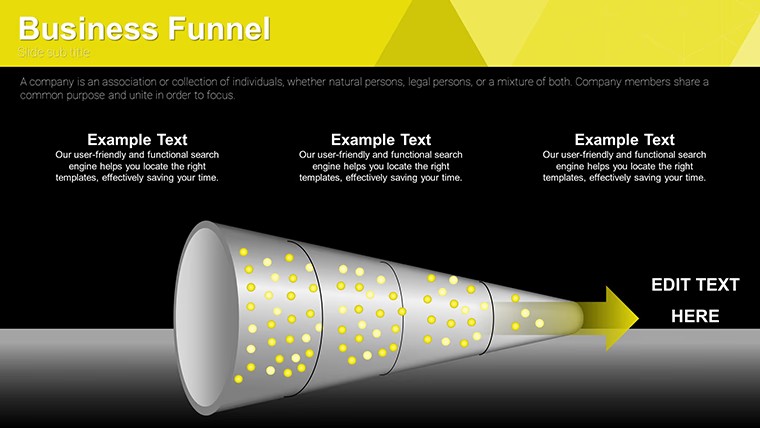
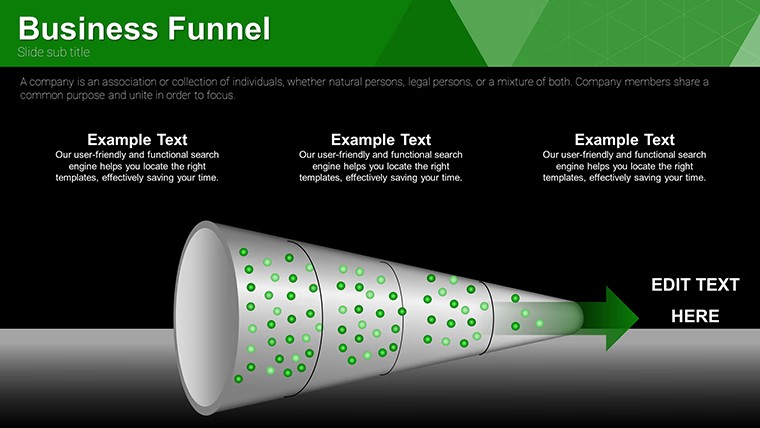
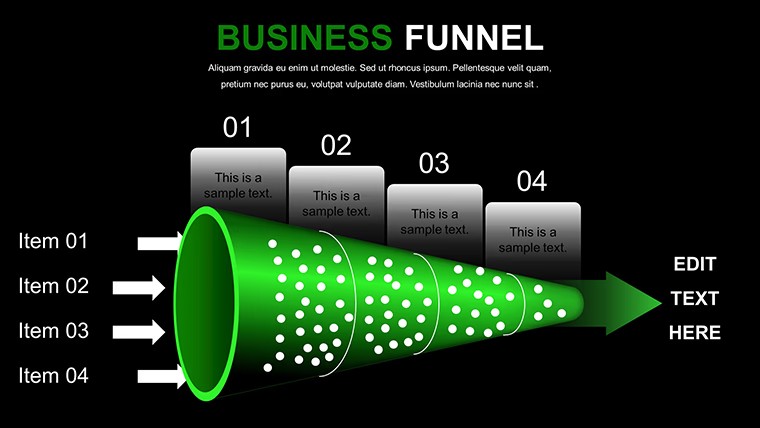
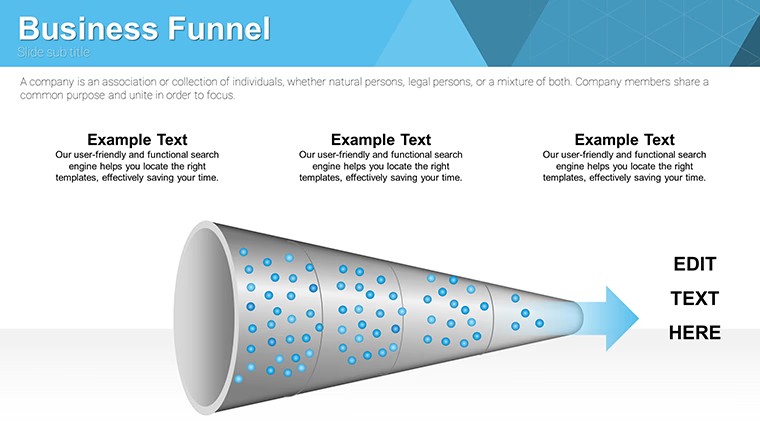
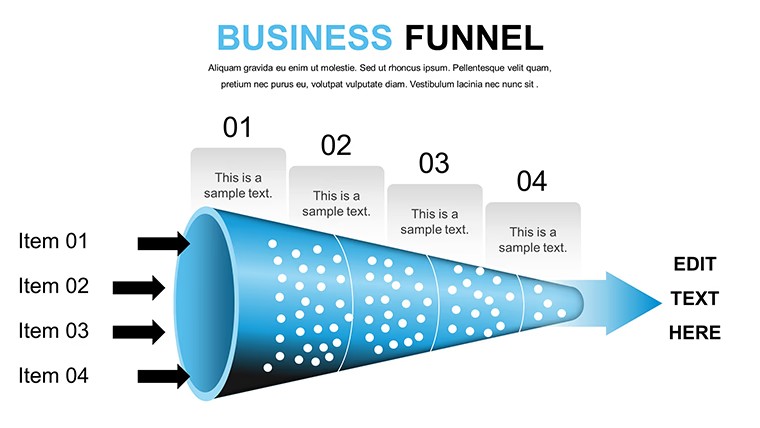
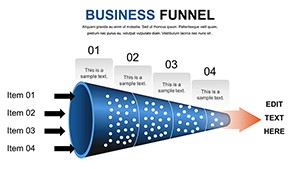
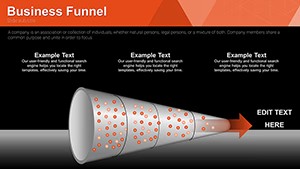
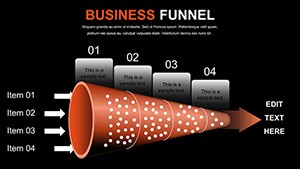
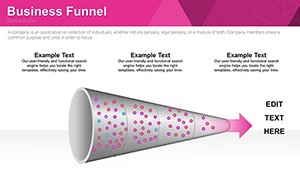
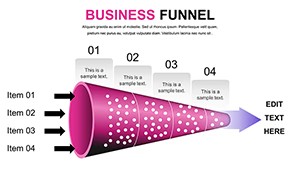
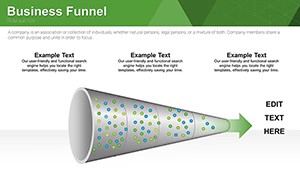
Funnel Structures for Conversion Tracking
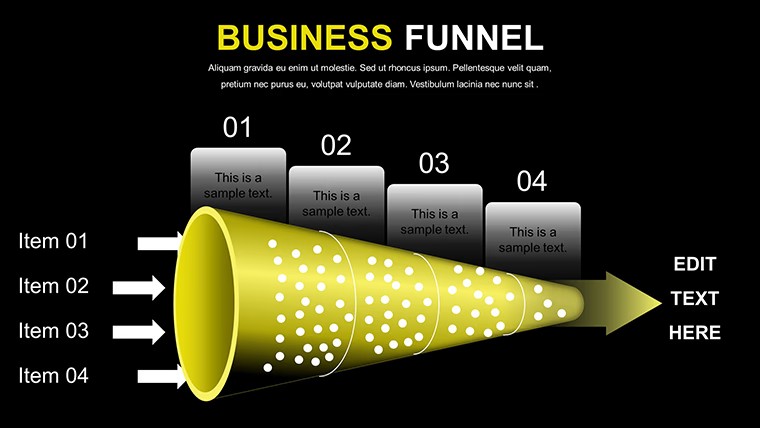
No generic shapes just multi-stage funnels with integrated bar graphs for sales pipeline review.
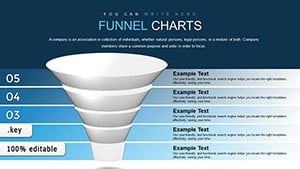
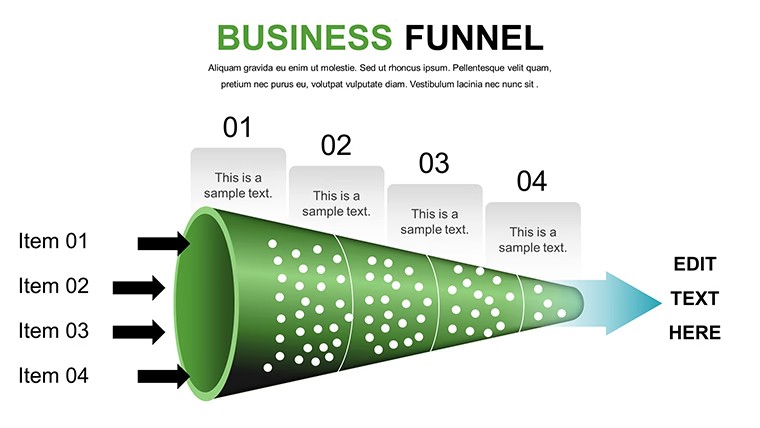
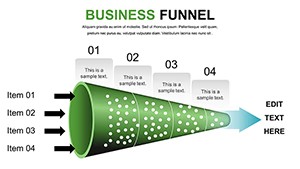
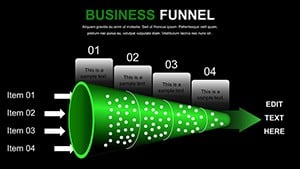
16 editable slides with standard inverted and multi-stage layouts let sales leads show drop-off points to executives without manual construction.
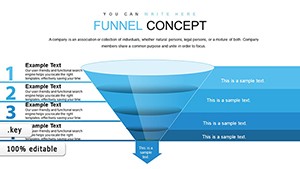
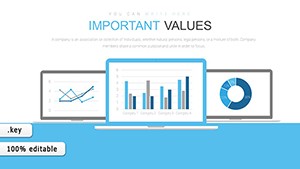
When you need to visualize conversion flows the hierarchical stages handle input data like leads and ROI directly.
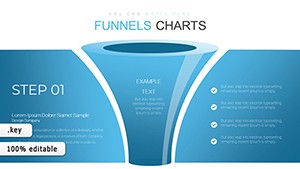
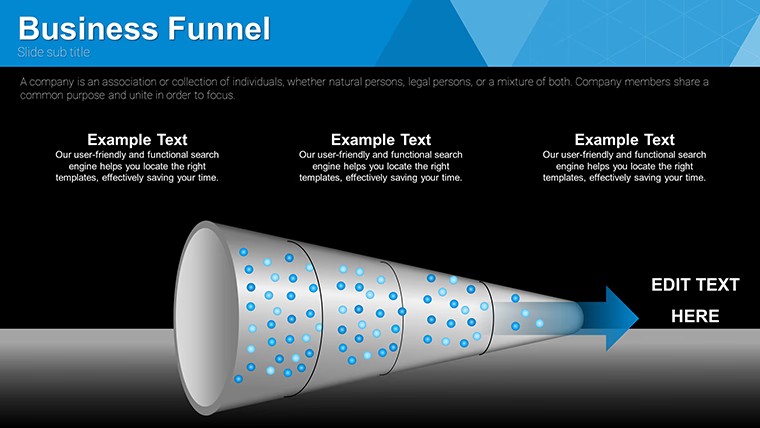
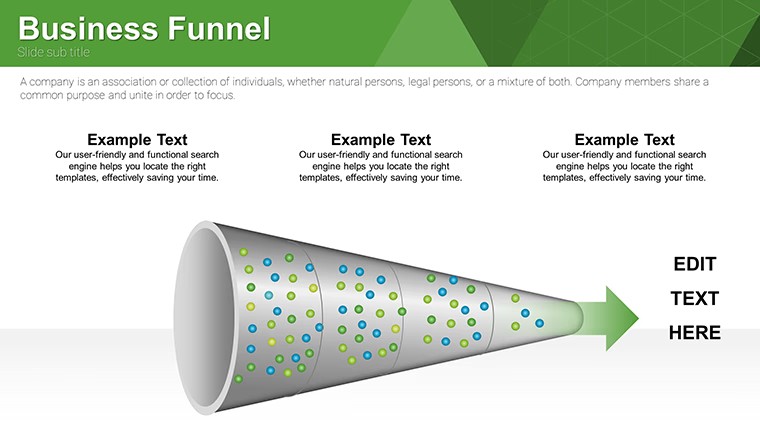
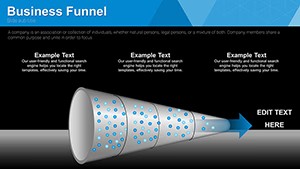
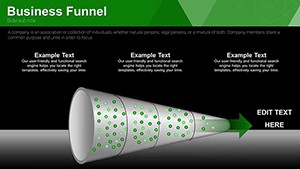
Use this instead of building diagrams manually when you need to keep structure readable in a single slide.
Everything aligns automatically so you avoid spacing tweaks.
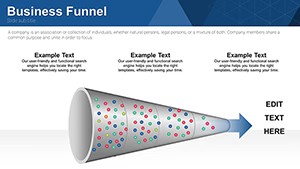
Typically you replace metrics and the funnel holds across reports.
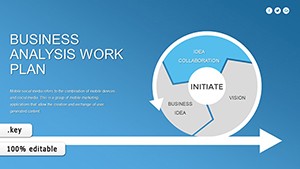
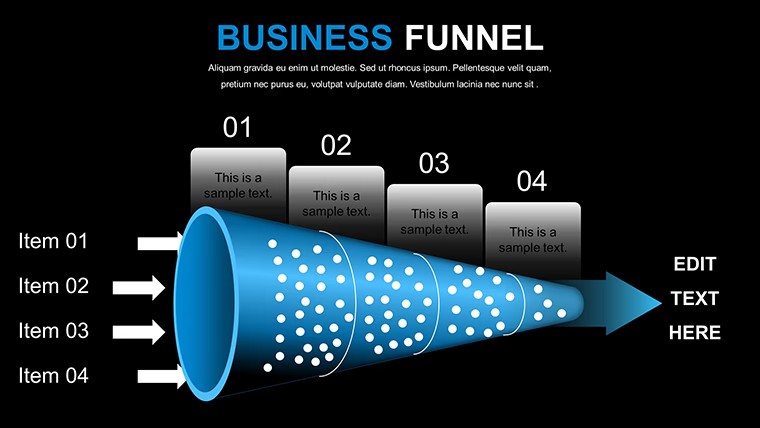
It works best for structured sales analysis not open narrative decks.
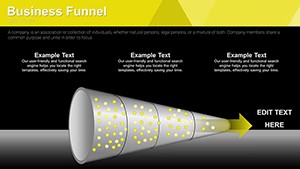
This layout is not ideal for creative visual storytelling or photo-based slides.
| Feature | Details |
|---|---|
| Slides / diagrams | 16 funnel diagrams (standard inverted multi-stage) |
| File format | KEY |
| Software version | Keynote 6 and later |
| Color schemes | Editable via slide master |
| Editable elements | Stages bars text resize independently |
| Aspect ratio | 16:9 widescreen |
| Free vs Paid | Free includes full 16 slides; paid details not listed |
| Masters / Backgrounds | Slide masters for consistent changes |
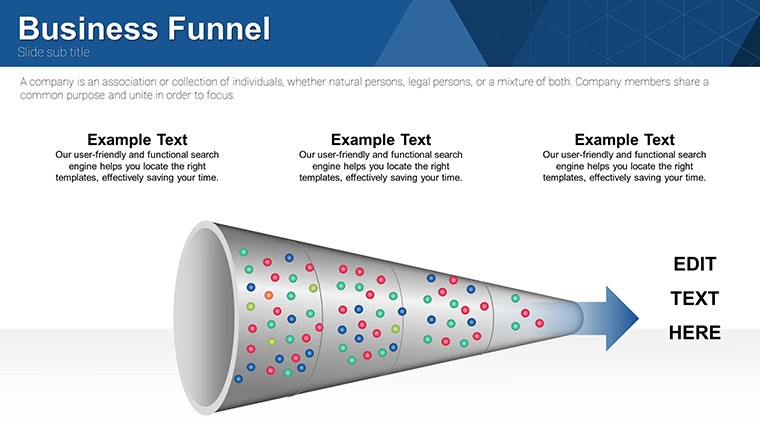
You open the file and start editing.
Download and start editing immediately
How do I change colors via slide master?
Open slide master view in Keynote. Select the funnel stage. Adjust color and all related slides update automatically.
Can I use this for client work?
The license permits commercial use including client projects. You may not resell or redistribute the original template files. Customized output belongs to you.
What is the difference between free and paid version?
This free version includes the complete 16 editable slides. Paid versions may include more stages but details are not specified on this page.
What are the refund conditions?
Refunds are available within 14 days if the file does not work as expected and has not been used in any project. Contact support with order details.
Animation supported or not?
Basic entrance animations are supported in Keynote. The funnel stages can be revealed step by step if you enable them manually.
Creative Funnel Charts Keynote Template or Funnel Concept Keynote Charts for Flows.