Keynote Charts Template - Instant Download | ImagineLayout


Type: Keynote Charts template
Category: Free Templates, Flow
Sources Available: .key
Product ID: KC00614
Template incl.: 12 editable slides
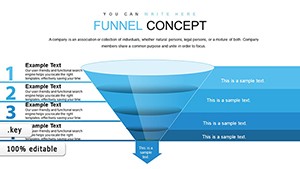
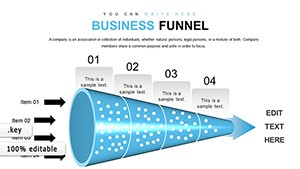
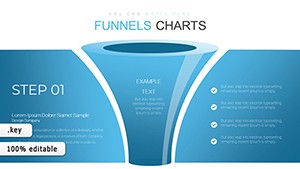
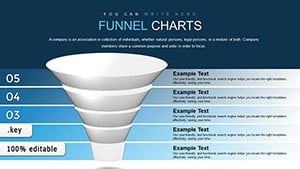
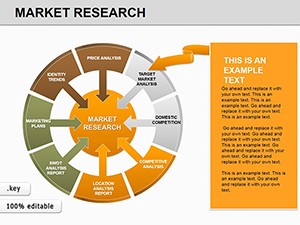
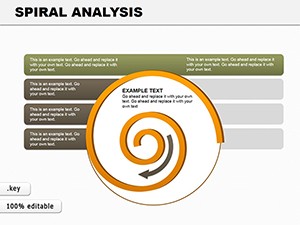
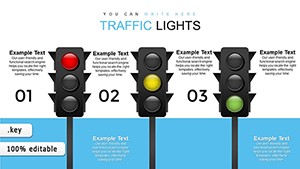
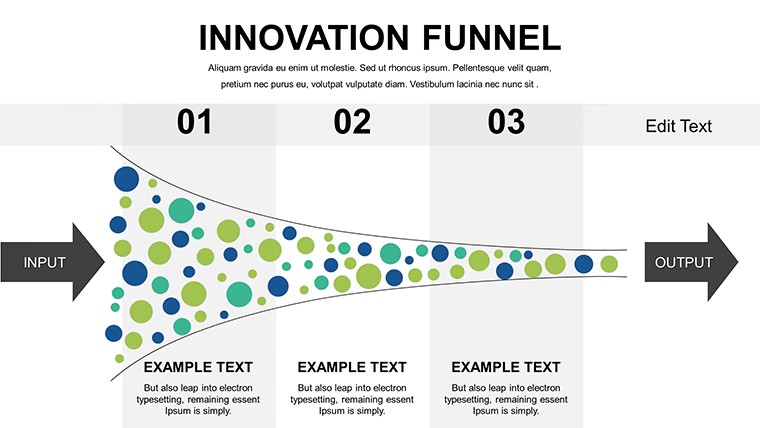
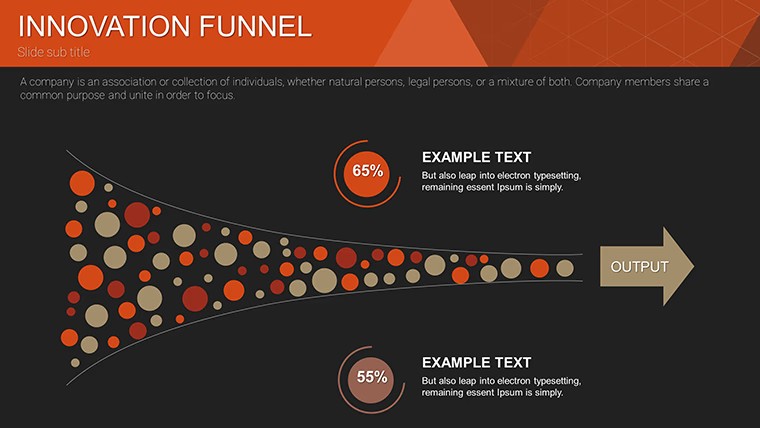
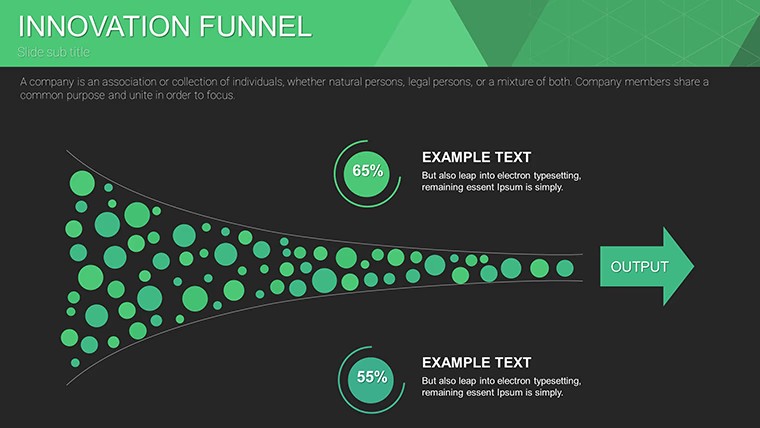
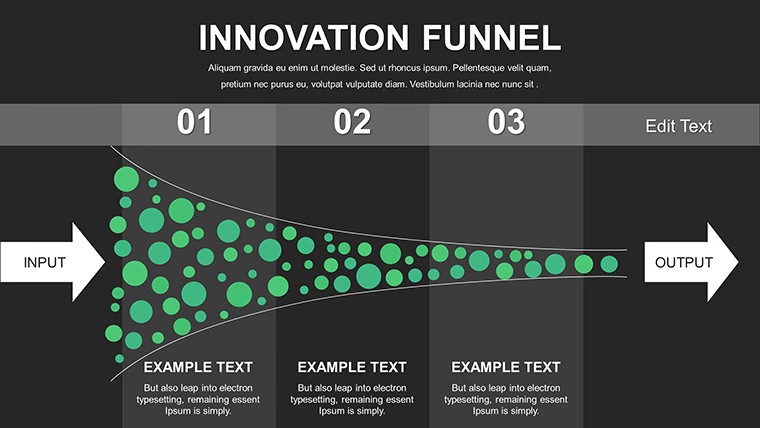
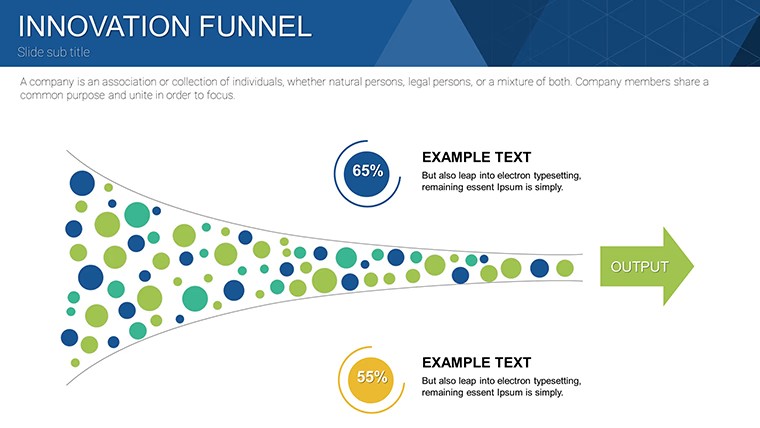
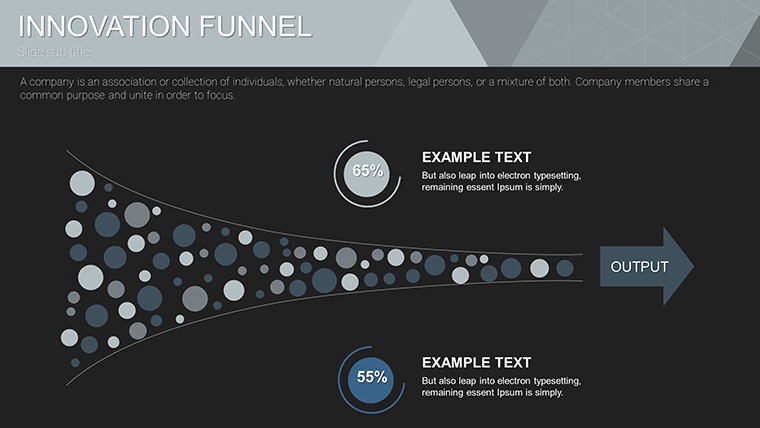
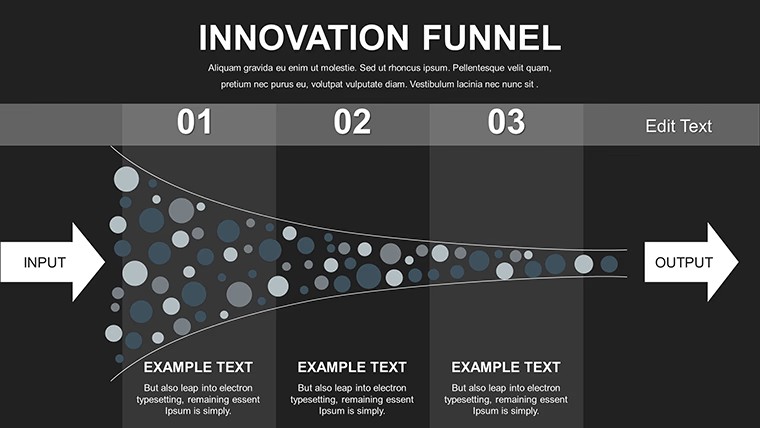
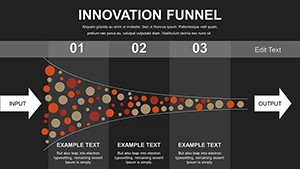
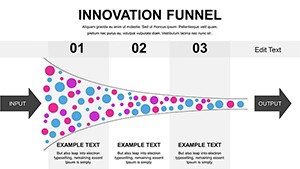
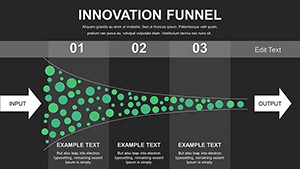
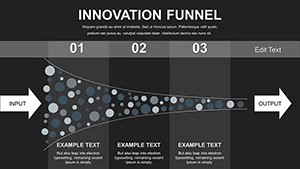
Keynote Charts Template
The page does not list the exact slide count color schemes or preview details yet the KEY file follows standard formats compatible with current Keynote installations.
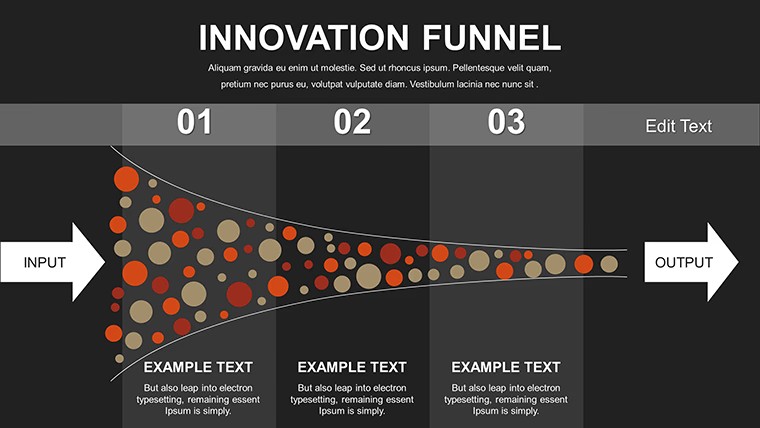
For quarterly board decks with no designer the structure organizes complex content without manual alignment.
No setup needed.
You drop in your data and it works in most cases while teams reuse the same file across weekly reports.
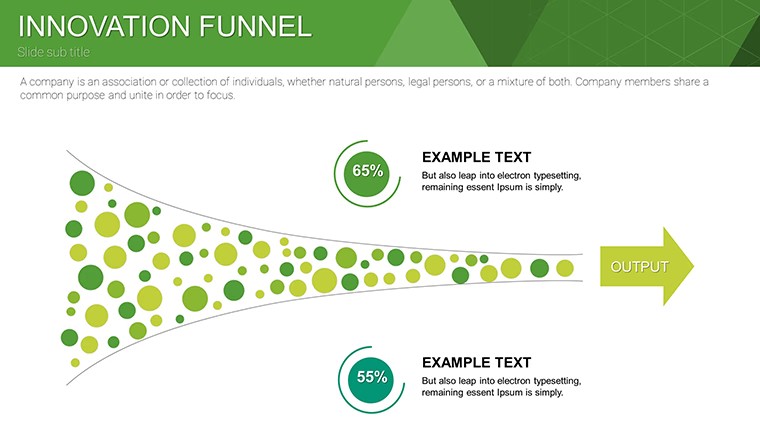
The page does not list specific visual details like stroke weight or layout direction but the charts support color swaps text insertions icon adjustments resize recolor and rearrange elements.
Project managers use this when they need to explain status updates to stakeholders without building diagrams manually.
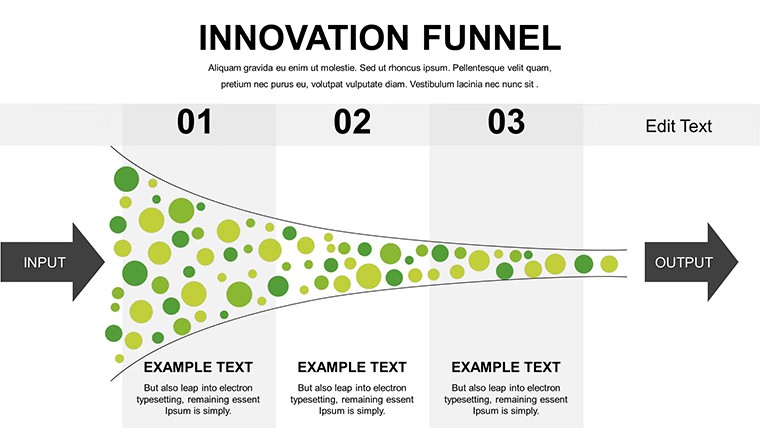
Use this instead of building diagrams manually in Keynote.
The predefined structure keeps everything aligned so you don't end up adjusting spacing slide by slide.
In practice it works best for structured diagrams not creative storytelling slides.
Not ideal for data-heavy dashboards where custom formulas matter more than visual status signals.
Everything is already structured.
| Feature | Details |
|---|---|
| Slides / diagrams | Not specified on page |
| File format | KEY |
| Software version | Apple Keynote current installations |
| Color schemes | Not specified on page color swaps via master |
| Editable elements | Data points colors fonts layouts resize recolor |
| Aspect ratio | Not specified on page |
| Free vs Paid | Free version only details not listed |
| Masters / Backgrounds | Standard master for color changes |
You open the file and start editing.
Download and start editing immediately
Does it work with Keynote 12+ on macOS?
The template uses standard KEY format compatible with Apple Keynote.
In most cases it runs on macOS 10.15 or later.
Test the file after download to confirm your version.
Can I use this for client work?
Yes the license allows client presentations.
You cannot resell the template file itself.
One license covers one user for commercial projects.
What is included in the free version?
The free version includes the full KEY file with editable slides.
The page does not specify a separate paid version.
All slides are ready to edit immediately.
What are the refund conditions?
The page does not list specific refund conditions.
Standard marketplace policy applies if the file does not open correctly.
Contact support within 14 days of purchase for assistance.
How do I change colors via slide master?
Open the slide master view in Keynote.
Select the chart elements and update fill colors.
Changes apply across all slides automatically.