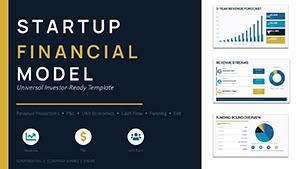
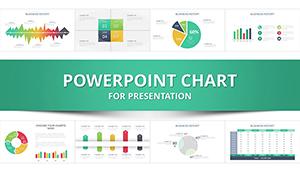
Our PowerPoint workflow chart templates fuse quantitative tracking with qualitative flows, offering hybrid views of performance and progression. Perfect for monitoring milestones alongside metrics in dynamic environments.
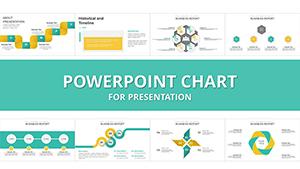
Designed for analysts, planners, and overseers, they enable holistic oversight. Blend bars with arrows, metrics with maps, for narratives that quantify journeys.
This workflow chart niche delivers hybrids like Gantt-infused flows or KPI-embedded sequences, all PowerPoint-native. Gain insights at a glance - curate your collection today.
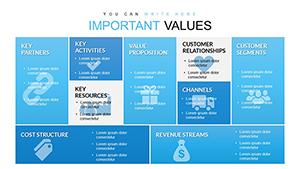
Free Business Model Canvas PowerPoint Template - Instant Download
ID: #PC00612
free
(184)
Choice and Advantages PowerPoint Charts: Master Decision Visuals
ID: #PC00563
$18.00
(266)
Sphere of Influence PowerPoint Charts: Map Networks and Impact
ID: #PC00562
$20.00
(381)
Positive and Negative Effects of Technology PowerPoint Charts Template
ID: #PC00561
$20.00
(381)
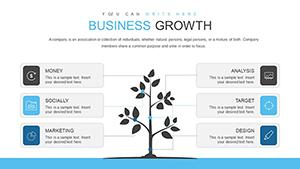
Growth Prospects PowerPoint Charts Template: Propel Your Business Forward
ID: #PC00559
$23.00
(760)
Cause and Effect PowerPoint Charts Template for Presentation
ID: #PC00557
$16.00
Hybrid Power in Workflow Charts
Unique: Data-driven nodes that update visuals automatically, merging static diagrams with live charts. Transcends separate tools for unified intelligence.
Project managers chart resource allocation with burn-down hybrids. Marketers track campaign ROI via funnel metrics. Healthcare maps patient paths with outcome stats.
Hybrid Horizons
Resource Planning: Gantt bars with allocation pies.
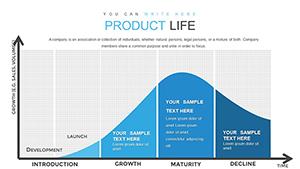
Performance Tracking: Line flows with variance highlights.
Risk Assessment: Matrix charts with probability arrows.
Quality Control: Control charts with process deviations.
Insight acceleration: Combines views for 30% faster decisions.
Charting Workflow Excellence
Harmonize scales: Align chart axes with flow timelines. Threshold color shifts for alerts. Sequence reveals to pace information delivery.
Smart play: Dashboard embeds for overview slides. Ensure data privacy with masked inputs.
Integration Steps
Link external data sources.
Sync chart to diagram elements.
Automate via VBA if advanced.
Audit for accuracy.
Quantify quests - acquire a chart.
Impactful Integrations
Ops team`s velocity chart with sprint flows optimized iterations. Retailer`s conversion funnel with traffic lines boosted optimizations.
Power BI compatible for expansions.
Hybrid Highlights
Hybrid
Combo
Value
Gantt-Flow
Time+Steps
Progress Tracking
KPI-Arrow
Metrics+Path
Goal Alignment
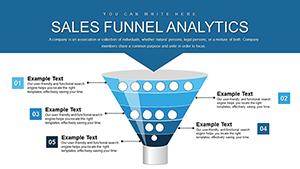
Funnel-Line
Conversion+Trend
Drop-off Analysis
Versatile merges for multifaceted needs.
Measure motion - download hybrids.
Frequently Asked Questions
Elevating Hybrid Visuals
Layer interactivity with hotspots. Benchmark against industry norms. These tools turn data streams into strategic streams.
Group edits via cloud; version for audits.
PowerPoint workflow charts converge clarity and metrics. Converge yours.