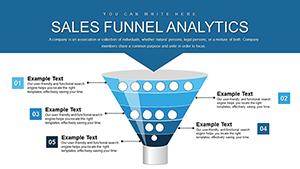
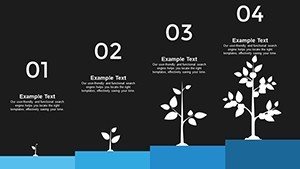
Sales Growth Earnings PowerPoint Charts - Editable Forecast & Earnings Data Visuals


Type: PowerPoint Charts template
Category: Analysis
Sources Available: .pptx
Product ID: PC00697
Template incl.: 28 editable slides
Why Use This Template
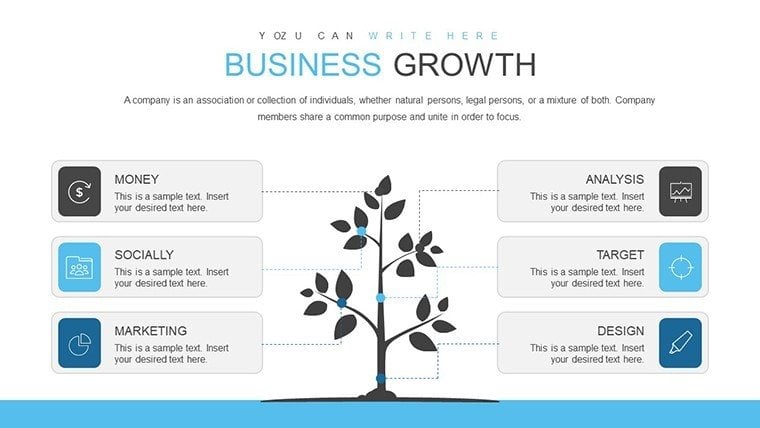
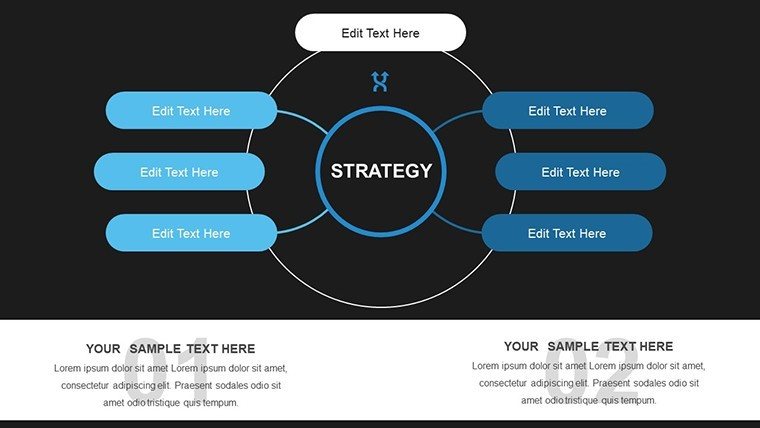
This template addresses a common problem: default PowerPoint charts often lack polish and narrative power, especially when you need to communicate sales trajectories and earnings forecasts clearly to decision-makers. With 28 fully editable slides tailored to growth and earnings visualization, you can explain trends, compare periods, and highlight critical inflection points without design bottlenecks.Who It`s For
- Financial analysts preparing executive summaries
- CEOs and founders presenting results to investors
- Sales leaders reporting quarterly achievements
- Consultants illustrating performance trends
How It Helps Your Workflow
This template integrates seamlessly into your existing workflow: open in PowerPoint, paste your data, adjust colors to match your brand, and refine narratives for your audience. It works with PowerPoint 2016+ and Google Slides for collaborative edits. The editable charts, clean layouts, and ready-structured slides mean you spend minutes customizing, not hours designing.Core Features
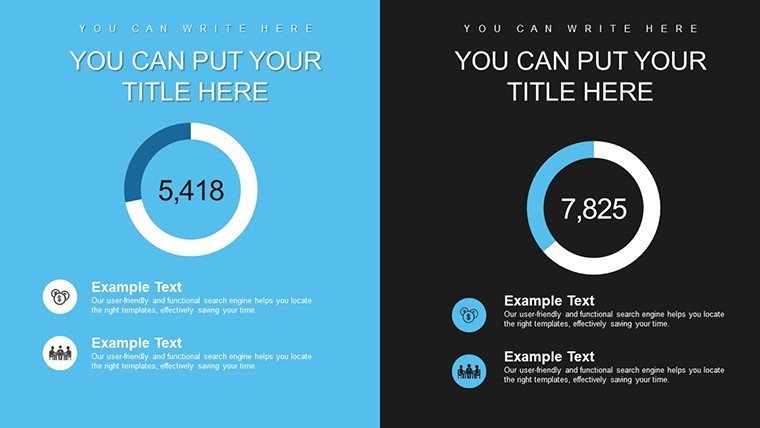
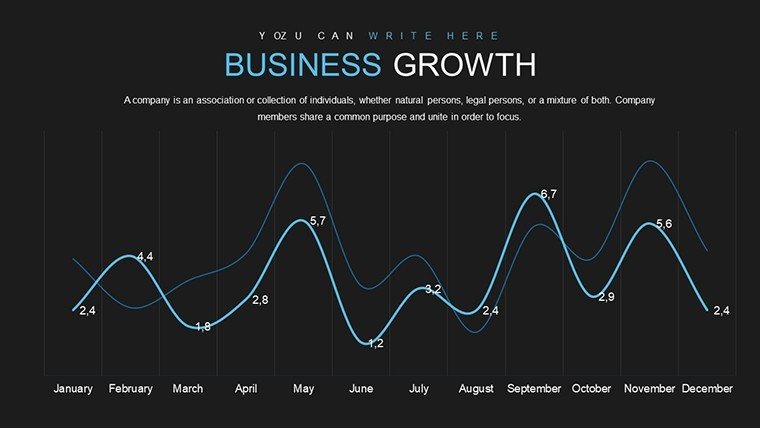
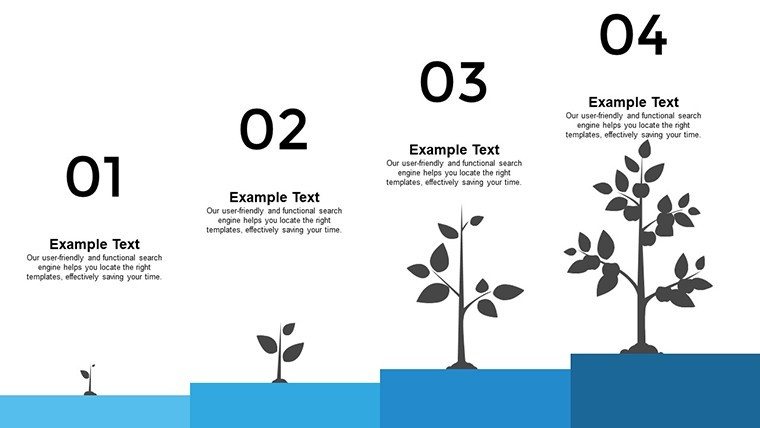
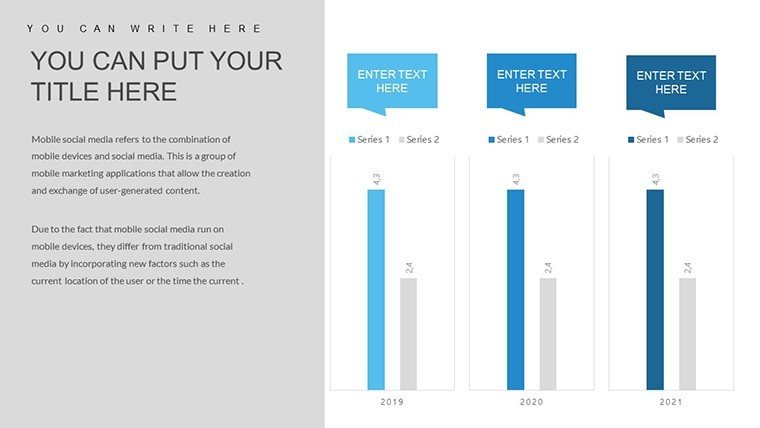
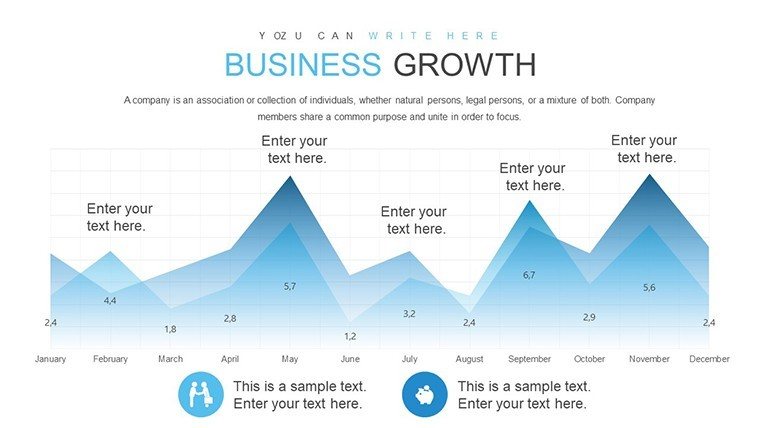
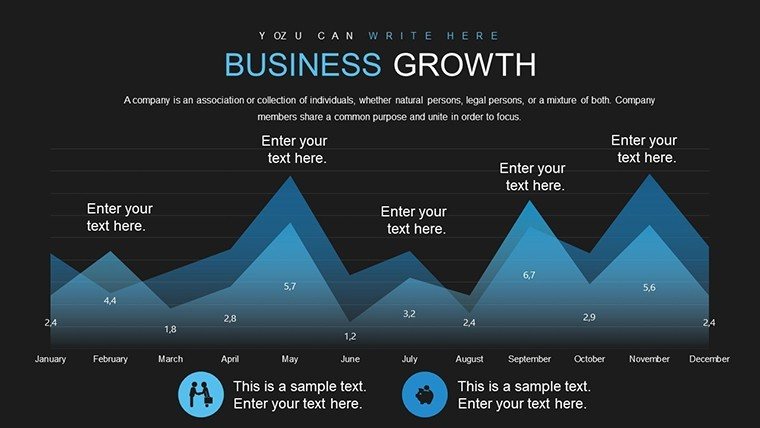
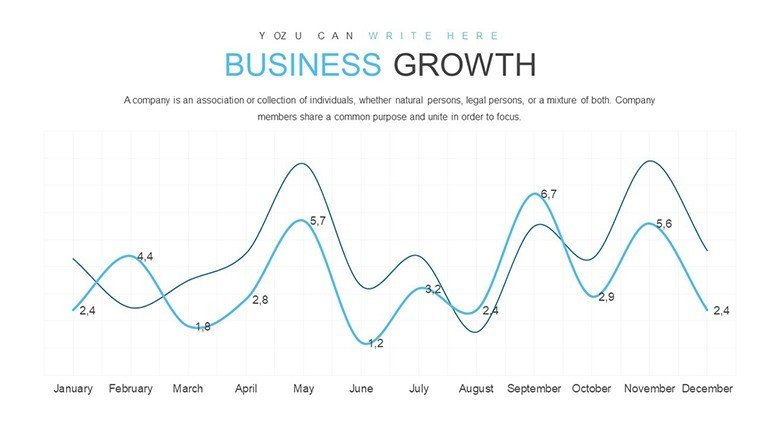
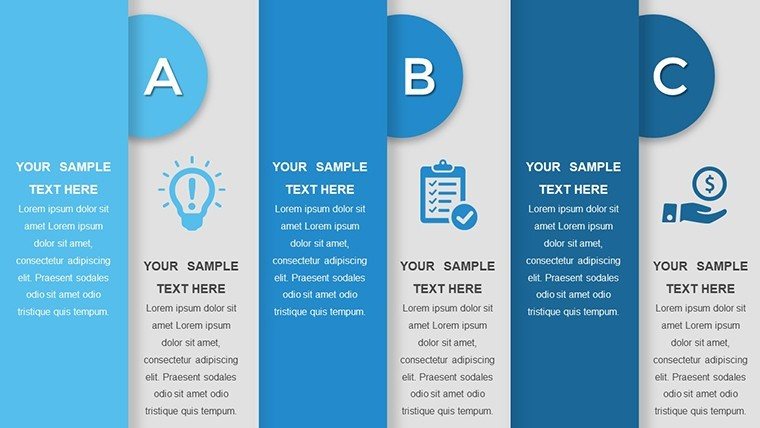
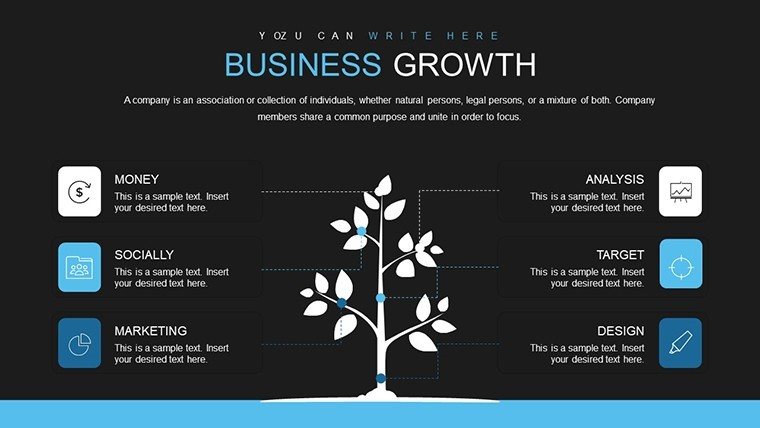
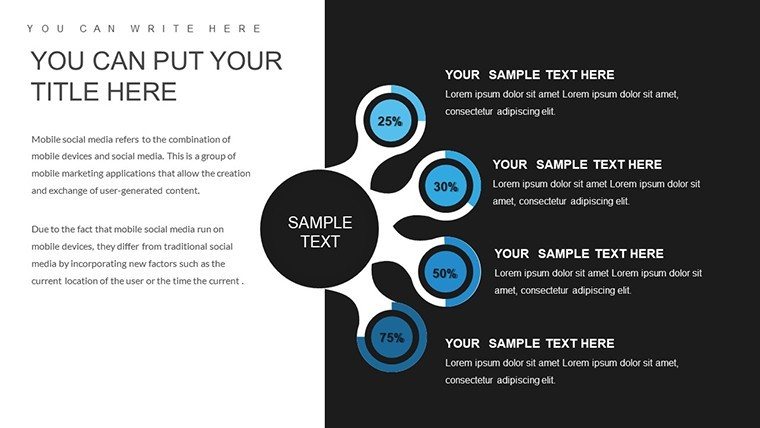
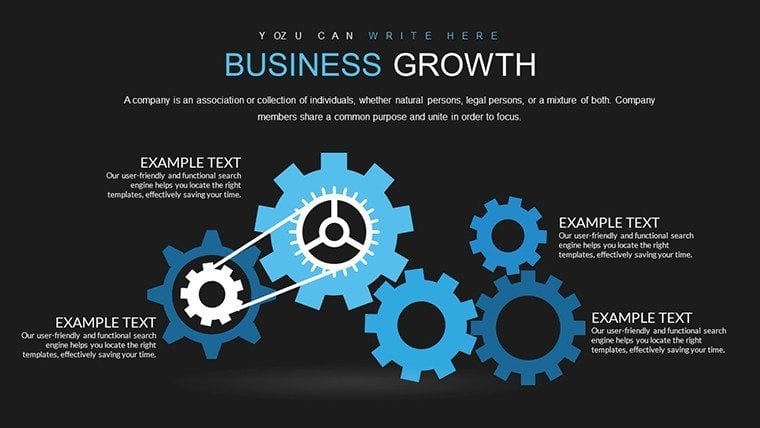
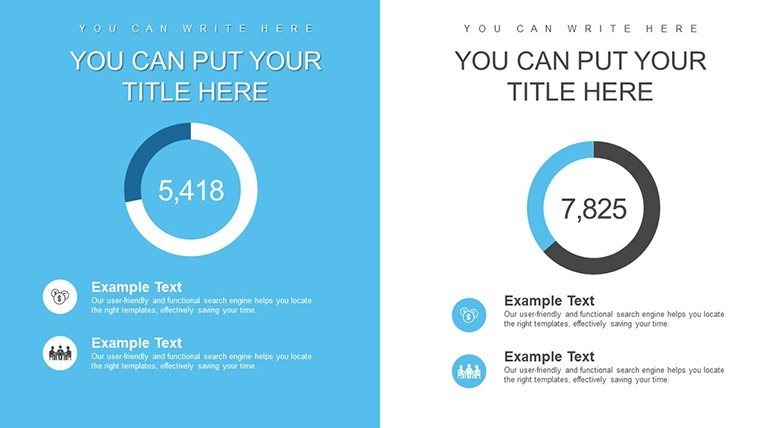
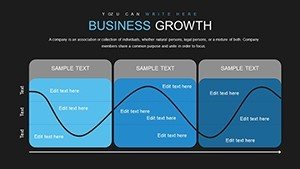
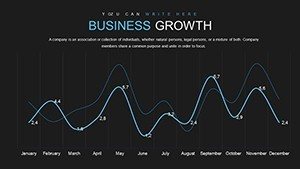
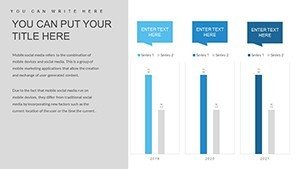
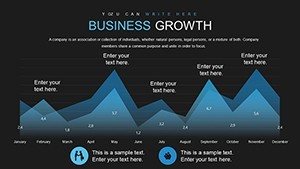
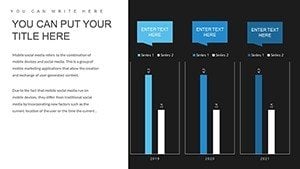
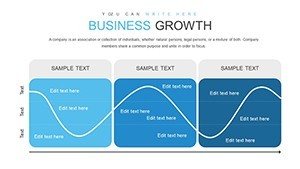
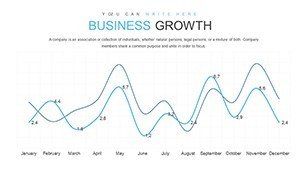
- Editable line, bar, and comparison charts for growth and earnings
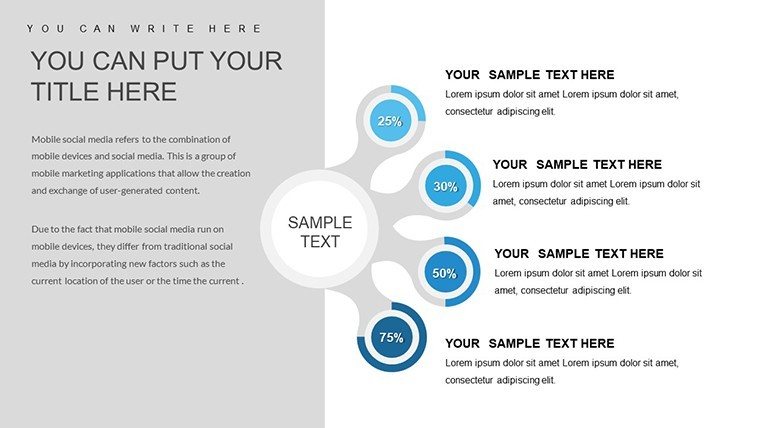
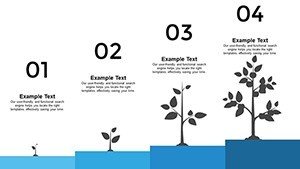
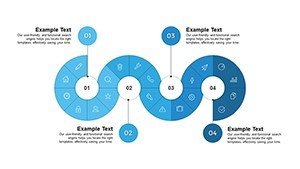
- Prebuilt forecasting visuals that accentuate trends
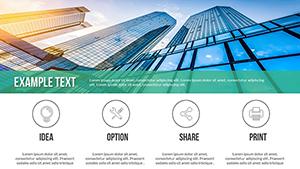
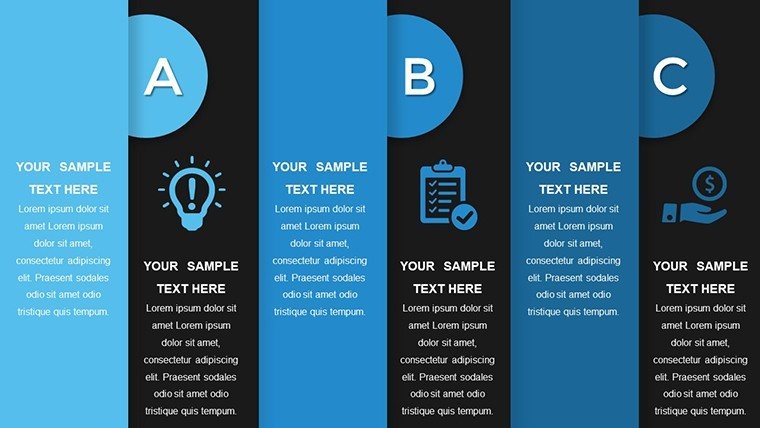
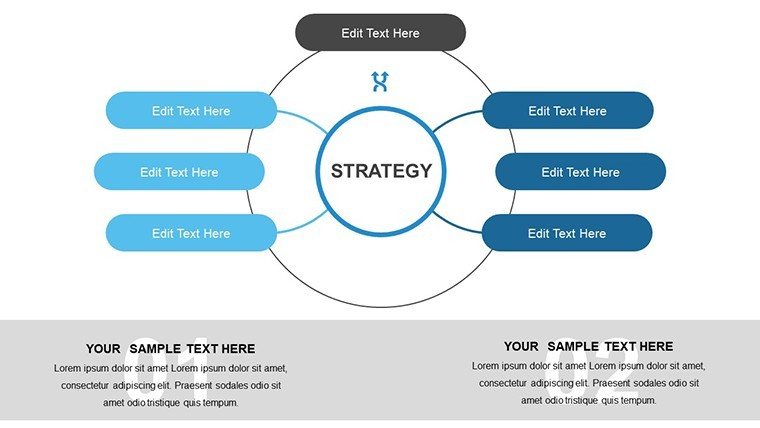
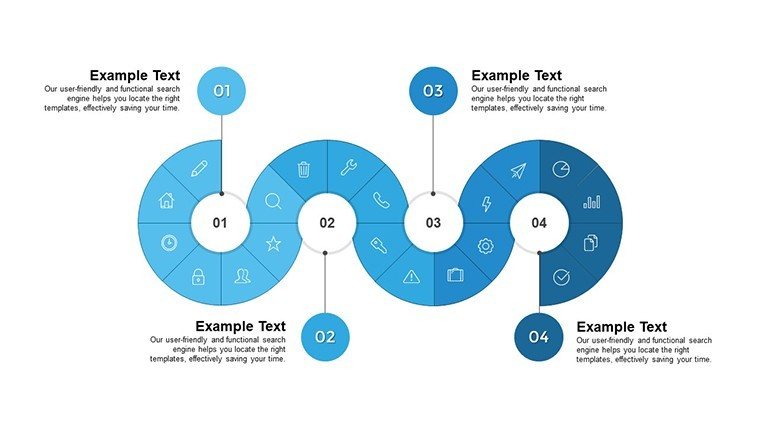
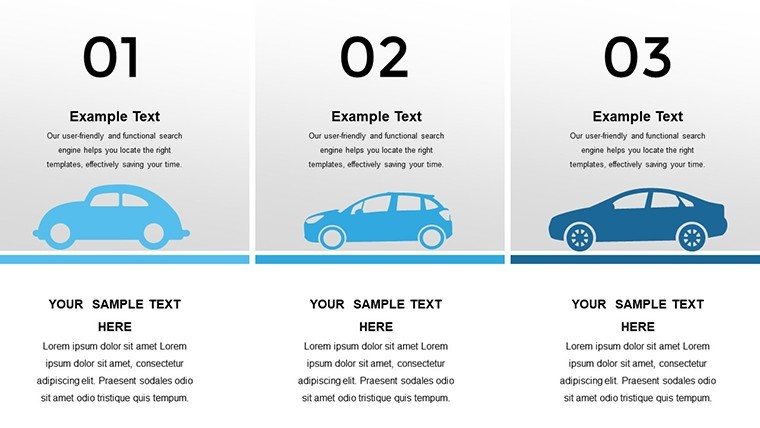
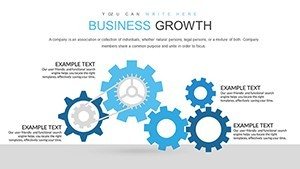
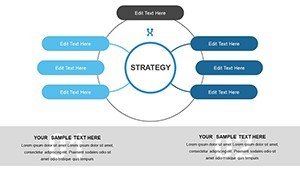
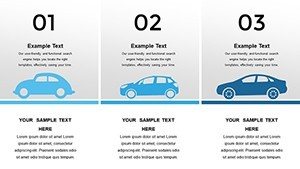
- Clean layouts optimized for executive audiences
- Compatibility with common presentation platforms
Professional Presentation Scenarios
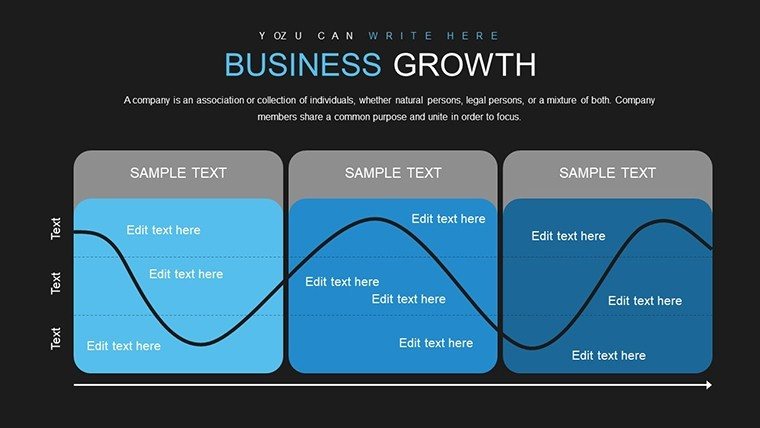
- Board Meetings: Use side-by-side growth vs. earnings slides to anchor discussions on strategic priorities.
- Investor Updates: Highlight performance and trajectory with clearly labeled forecasts and trend lines.
- Sales Reviews: Visualize team achievements with data-driven charts that align with narrative goals.
Internal Comparison: Slide Types & Outcomes
| Slide Type | Best For | Outcome |
|---|---|---|
| Trend Line Chart | Earnings trajectory | Shows momentum and forecasts |
| Bar Comparison | Period vs. period | Immediate performance comparison |
| Combined Chart Layouts | Executive summaries | Holistic view of performance |
Industry Applications
- Finance teams tracking profitability and cost structures
- Startups communicating growth to venture capital firms
- Sales operations reviewing product performance across regions
- Consultancies crafting data-centric reports for clients
Frequently Asked Questions
When should I use this template?
Use it whenever you need to present sales growth, earnings performance, and forecasting to executives, stakeholders, or investors - especially when clarity and professionalism matter.
Can I edit these charts in Google Slides?
Yes! Imported into Google Slides, the layouts remain editable and clean, though some advanced chart features may need manual adjustment.
Is this template suitable for financial reports?
Absolutely. It`s designed around visual clarity for earnings, sales, and trend narratives, ideal for quarterly and annual reports.
How do I update data quickly?
Paste your updated figures into the linked PowerPoint chart data panels or Google Slides equivalents and refresh labels for accurate visuals - no redesign required.