Sales Forecast PowerPoint Template and Charts


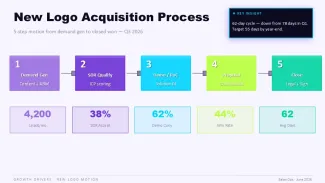
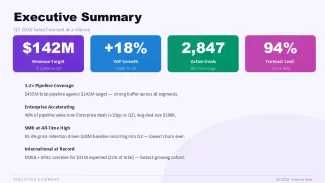


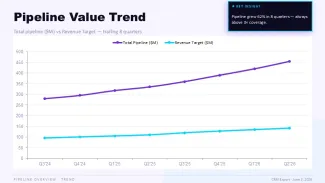
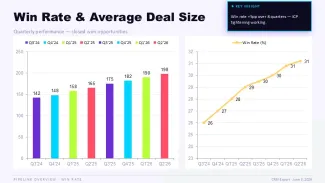


This Sales Forecast PowerPoint template provides 33 editable slides focused on visualizing sales performance, revenue projections, and trend analysis. Sales managers, analysts, and executives use it for board updates, investor meetings, and internal planning to present clear data-driven forecasts.
The layouts maintain alignment when duplicating slides or adjusting data series. Placeholder charts resize proportionally with content updates, while grouped elements like axes labels and legends stay coordinated. Slide Master controls allow global color theme changes that propagate across all graphs without breaking layouts.
- Charts update automatically with new data while preserving custom formatting and grid spacing.
- Long category labels wrap or abbreviate cleanly without disrupting overall slide balance.
- Vector icons and shapes remain fully editable and scalable.
- Multiple layout variations support different forecast horizons and comparison views.
- Consistent 16:9 aspect ratio ensures compatibility across display environments.
| Specification | Details |
|---|---|
| Slides | 33 editable slides |
| Format | .pptx |
| Aspect Ratio | 16:9 |
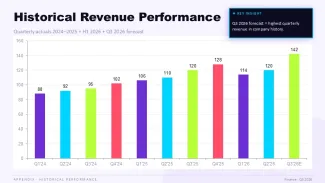
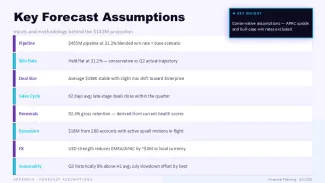
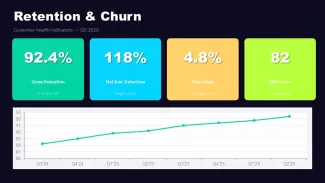
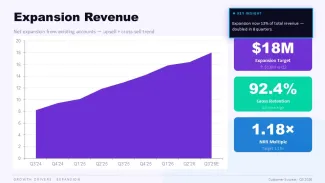
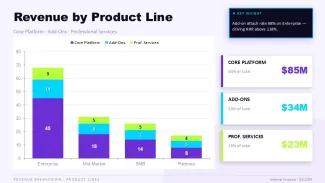
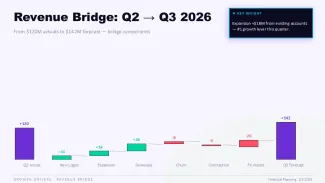
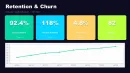
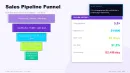
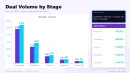
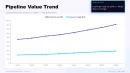
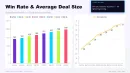
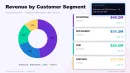
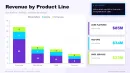
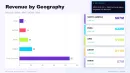
| Charts | Line, bar, area, and combination graphs with editable data |
| Customization | Slide Master for theme colors; individual objects for fine control |
| Software | PowerPoint 2016 and newer (Windows/Mac) |
Frequently Asked Questions
Does this template work in older PowerPoint versions?
It is optimized for PowerPoint 2016 and later. Charts and layouts use standard features that maintain integrity in recent versions, though some advanced effects may require verification in very old releases.
How do I change the overall color scheme?
Apply a new theme via Slide Master. Colors update across all charts, backgrounds, and text elements while preserving data-driven formatting and alignments.
Are the charts and icons fully editable for commercial client work?
Yes. All vector elements, graphs, and text are customizable. Standard commercial usage rights apply for client presentations and internal reports.