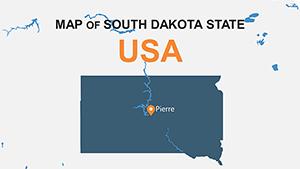
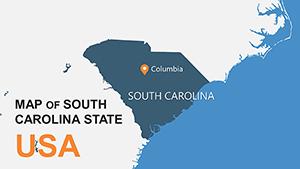
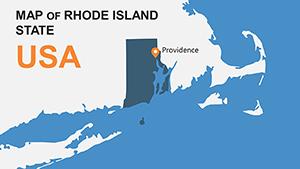
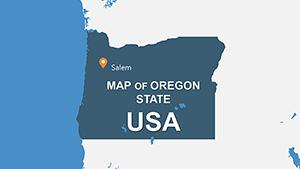
Elevate your presentations with our premium collection of editable USA map templates designed for PowerPoint. These templates feature detailed state outlines, allowing effortless customization to spotlight regions, add markers, and tailor colors to your branding.
Ideal for sales teams mapping territories, educators covering American geography, or analysts presenting demographic trends, these versatile designs deliver clarity and professionalism.
From highlighting coastal states to pinpointing major cities like New York, Chicago, or Los Angeles, create engaging slides that inform and impress.
Dive into the collection and select templates that perfectly suit your needs for compelling storytelling.


Editable USA map templates transform ordinary slides into powerful visual tools. Each state is an independent shape, enabling precise highlighting, color changes, and data overlays without quality loss.
Business users can map customer distribution across regions like the Midwest or Southwest, while educators illustrate historical events or electoral data state by state.
Enjoy vector-based states for unlimited scaling, pre-placed markers for capitals and cities, and compatibility with animations for smooth transitions.
These surpass generic options, providing superior flexibility and visual impact.
In marketing, showcase regional campaigns or store locations. For logistics, plot distribution networks from East to West Coast. Academic applications include population studies or economic comparisons between states.
Political analysts can visualize election results, while travel planners highlight routes through national parks or urban centers.
These templates streamline creation of informative, professional-grade slides.
Define your focus early - whether national overview or specific states. Apply color coding for data categories and use animations to reveal regions progressively.
Incorporate icons for industries (tech in California, finance in New York) and maintain clean typography for annotations.
Enhance your next project - explore our editable USA map templates and get started today.
Cover all 50 states with detailed borders, perfect for in-depth analysis or broad overviews. Turn data into stories that resonate with your audience.
Find the right template to make your presentation unforgettable.
Each state is a separate vector shape, fully customizable for color, size, outline, and grouping.
Yes, easily add pins, text boxes, or icons to mark locations and display information.
Perfect for it - color-code regions, add performance data, and create clear territory visuals.
Fully compatible, allowing state-by-state reveals or highlighted animations for engagement.
Greater detail, complete editability, and professional designs for more effective communication.
Excellent for geography lessons, history timelines, or demographic studies with interactive elements.
Copyright © 2009-2026 ImagineLayout All rights reserved.