Focus your data narratives with targeted PowerPoint chart templates that emphasize relevance and accuracy. Designed for analysts and strategists, these prioritize selective visualization to underscore critical metrics without noise.
From KPI dashboards to competitive analyses, the templates feature zoned layouts that isolate key data points. Customize thresholds with conditional formatting for instant highlights.
Versatile for boardrooms or reports, they integrate seamlessly with Excel imports. Uncover the power of precise charting - start downloading to target your storytelling effectively.
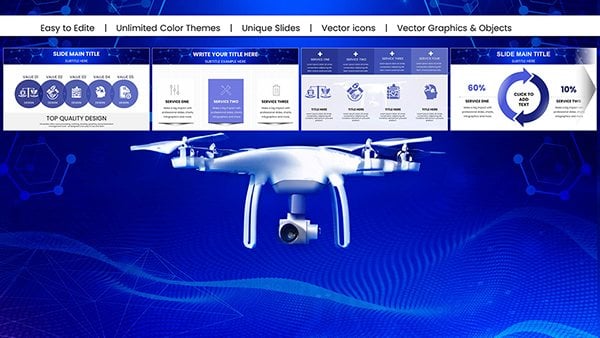
Flying Drone PowerPoint Charts Presentation: Capture Aerial Perspectives in Your Slides
ID: #PC01019
$18.00
(26)
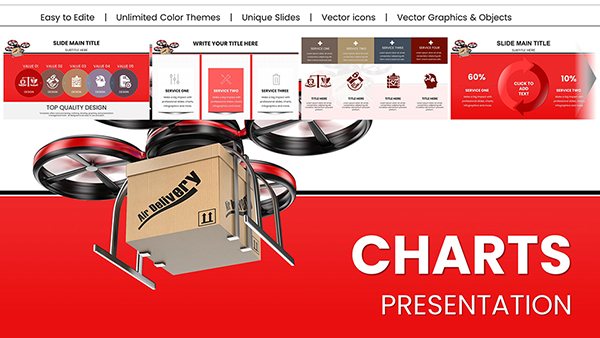
Heavy Cargo Drone Delivery PowerPoint Charts - Download Logistics Templates
ID: #PC01014
$20.00
(958)
Drone Delivery PowerPoint Charts Presentation: Chart the Course of Modern Logistics
ID: #PC01013
$22.00
(743)
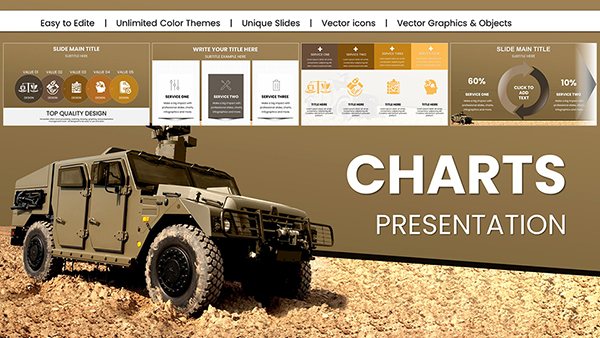
Military Vehicle PowerPoint Charts Template
ID: #PC01008
$20.00
(727)
Vibrant Beauty Makeup Cosmetics PowerPoint Charts: Sparkle in Every Slide
ID: #PC01004
$22.00
(1177)
Military Technology Drone Warfare PowerPoint Charts Template
ID: #PC00997
$18.00
(1136)
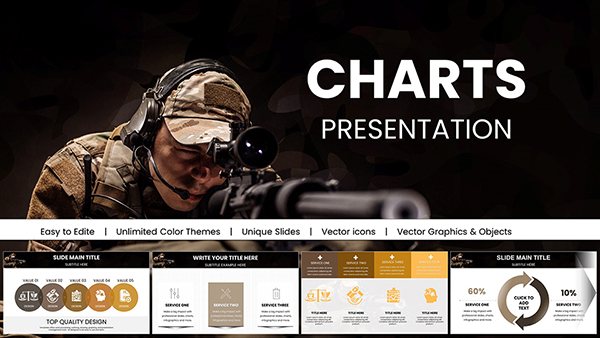
Sharpshooter PowerPoint Charts Template for Precision Presentations
ID: #PC00995
$18.00
(627)
Military Camouflage PowerPoint Charts Templates
ID: #PC00994
$18.00
(666)
War Armed Forces PowerPoint Charts - Download Presentation
ID: #PC00993
$16.00
(901)
Battle Military PowerPoint Charts Template - Instant Download | Tactical Briefing Slides for Defense & Operations
ID: #PC00992
$15.00
(516)
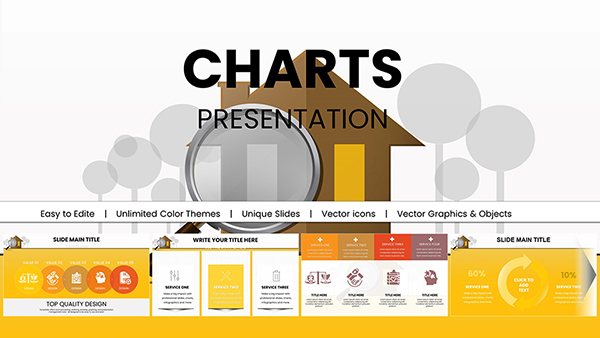
Real Estate Market PowerPoint Charts - 53 Editable Slides for Agents
ID: #PC00988
$18.00
(754)
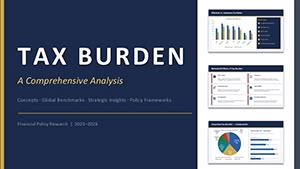
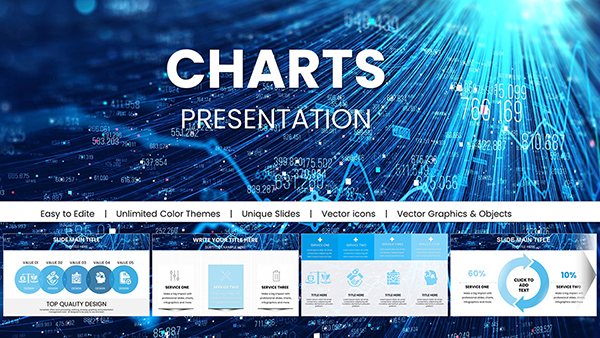
Data Financial PowerPoint Charts: Unlock Fiscal Clarity
ID: #PC00973
$20.00
(585)
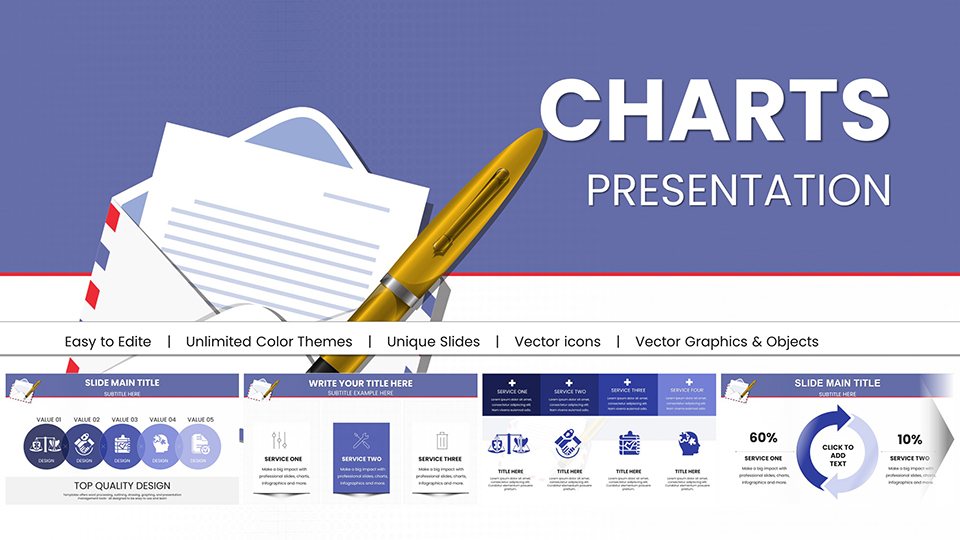
Business Correspondence PowerPoint Charts: Pro PPTX
ID: #PC00957
$20.00
(112)
Professional Business Report PowerPoint Charts Template
ID: #PC00938
$25.00
(910)
Sustainable Development PowerPoint Charts: Inspire Eco-Innovation
ID: #PC00937
$25.00
(290)
Financial Statement Analysis PowerPoint Charts: Decode Data with Precision
ID: #PC00932
$24.00
(133)
Financial Position PowerPoint Chart Template: Visualize Your Company's Health
ID: #PC00931
$24.00
Targeted Scenarios for PowerPoint Charts
In competitive intelligence, use targeted charts to spotlight market gaps via bubble plots. HR analytics employs heat maps for turnover trends, focusing on departments. Supply chain managers track bottlenecks with targeted Sankey diagrams.
Financial planners highlight variances in waterfall charts, zeroing on discrepancies. Sustainability reports use targeted gauges for progress dials.
Analytics Dashboards: Filterable slicers for dynamic views.
Performance Reviews: Bullet graphs for goal alignments.
Forecasting: Treemap for hierarchical projections.
Beyond Standard Charting Capabilities
Standard charts flood with data; ours target essentials, using masks and clips for focus. Defaults ignore context - ours add annotations dynamically. This sharpens decisions, with 50% faster insight extraction reported.
Scriptable elements allow VBA tweaks for automation, surpassing manual defaults.
Premium Features and Optimization Strategies
Features like data-driven thresholds and pivot integrations set them apart. AI-suggested scales auto-adjust for outliers.
Strategies: Define targets pre-design; use micro-charts for embeds. Employ accessibility contrasts, and validate with stakeholder previews. Innovate with geo-targeted maps or sentiment radars. Track via embedded analytics for refinements.
These empower precise, persuasive data delivery.
Zero In on Excellence
Secure targeted PowerPoint chart templates today and refine your data focus. Chart the path to sharper strategies.
Frequently Asked Questions
What targeting tools are built-in?
Conditional highlights and slicers for selective data display.