PowerPoint Tax Burden Analysis - Editable PPTX


Tax Burden Comprehensive Analysis PowerPoint Charts
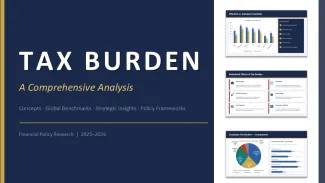
This is a 41-slide PowerPoint charts template built around fiscal breakdowns - mostly tax burden distribution, comparative tables, and a mix of pie-based and analytical layouts. It`s not trying to be decorative. Everything is structured around data chunks you`d actually present in a policy review or financial briefing.
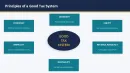
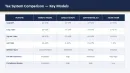
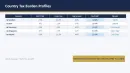
When I first opened the file, what stood out wasn`t complexity - it was how consistent the grid system is across all slides. You can drop in longer numeric labels and the alignment still holds. I tested a messy 12-row dataset in one of the table slides and it didn`t break the spacing at all. That alone already saves cleanup time.
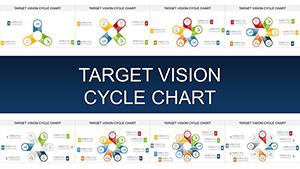
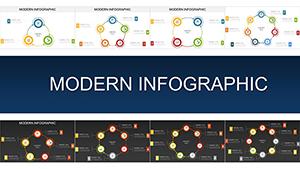
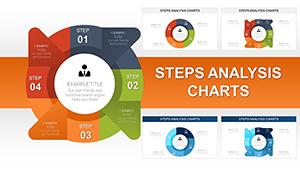
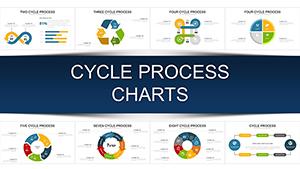
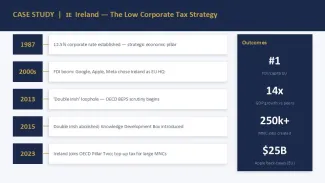
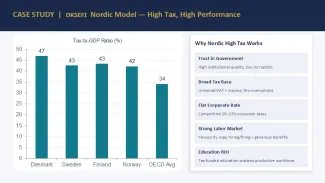
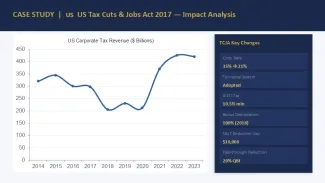
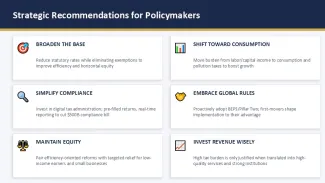
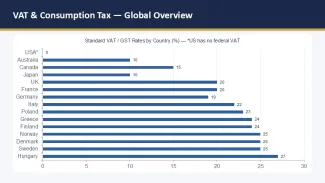
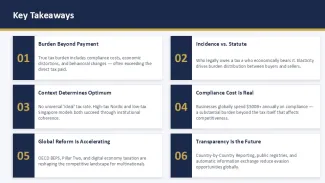
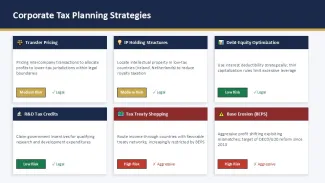
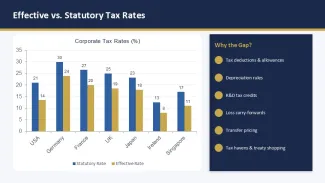
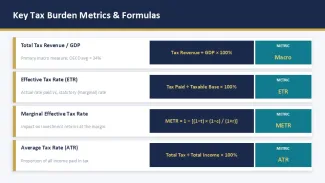
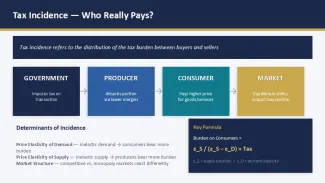
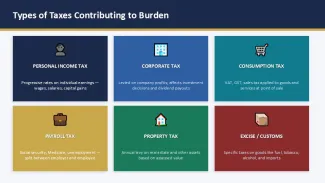
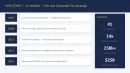
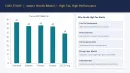
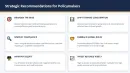
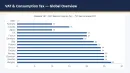
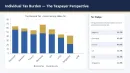
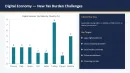
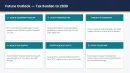
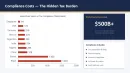
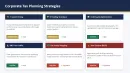
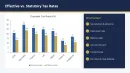
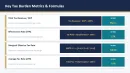
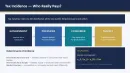
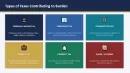
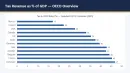
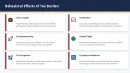
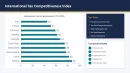
The deck includes pie charts, structured comparison tables, and a few layered "analysis blocks" where text and figures sit side by side. The diagram flow is mostly horizontal, with occasional stacked layouts for breakdowns. Icons are minimal outline style, thin strokes, nothing heavy or shaded. It keeps focus on numbers instead of visuals competing with data.
And honestly, the vertical alignment here is what makes it actually usable in real reporting. A lot of chart templates collapse once you extend labels - this one doesn`t. That`s probably its strongest point.
The color system is handled through the slide master. Slightly confusing at first - took me a second to figure out where the global palette lives - but once you find it, everything updates in under a minute. I always change the colors in the master first before filling anything in. Oh, and the aspect ratio is 16:9 by default.
The paid version is $15 and comes as .pptx only. No free version is listed here. You get the full slide set unlocked, but don`t expect multiple software formats - this is strictly PowerPoint-based.
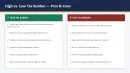
If your work involves tax reporting, public finance summaries, or stakeholder updates in government or consulting, this is one of those decks you don`t really "design" - you just populate it. You know that situation when the deck is due tomorrow and you don`t want to think about layout? This is exactly that kind of file.
Not ideal if you need heavy infographic storytelling or animated charts. But for structured fiscal comparison work, it stays predictable, which is kind of the point.
Also works for internal team updates, not just client decks.
Download and start editing immediately
Specs
| Feature | Details |
|---|---|
| Slides/diagrams | 41 slides: pie charts, tables, analysis blocks |
| File format | .pptx |
| Software version | PowerPoint 2016+ / 365 |
| Color schemes | 1 master palette, editable via Slide Master |
| Editable elements | Charts, tables, text blocks, icons scale cleanly |
| Aspect ratio | 16:9 |
| Free vs Paid | No free version; paid $15 full access |
| Masters/Backgrounds | 1 main slide master system |
FAQ
How do I change colors in PowerPoint quickly?
Start from the Slide Master, not individual slides - that`s the key part people miss. So basically, go View → Slide Master, change theme colors there, and everything updates across charts and tables. In most cases it takes under a minute once you know where it sits. Oh, and you can also export to PDF from there.
Can I use this template for client projects?
The short answer is yes, usually yes, but it depends a bit on the license terms shown at purchase. It`s the same license most marketplaces use - one buyer, commercial use allowed for presentation work. Honestly, I`ve seen people reuse these across multiple client decks without issues. That's basically it.
What`s the difference between free and paid version?
Free versions usually come stripped - fewer slides and sometimes locked chart groups. Paid here gives you all 41 slides and full editable charts. In practice, that means you don`t rebuild missing layouts yourself. Works as-is.
Can I get a refund after purchase?
Refunds depend on marketplace rules, not the template itself. Usually digital downloads aren`t refundable once accessed. To be honest, I`ve rarely seen exceptions unless the file is broken or unusable. That`s about it.
Is PowerPoint 2016 or Microsoft 365 compatible?
Yes, it runs fine in PowerPoint 2016, 2019, and Microsoft 365. No extras needed, just open the .pptx and edit. You drop in your data and it holds structure without breaking. And older versions might struggle with some chart editing features - depends a bit on system updates.