Project planning PowerPoint Charts

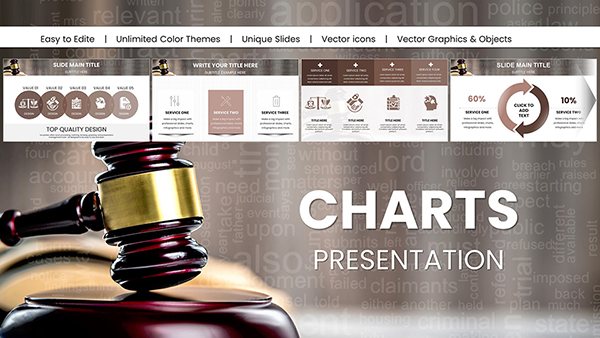
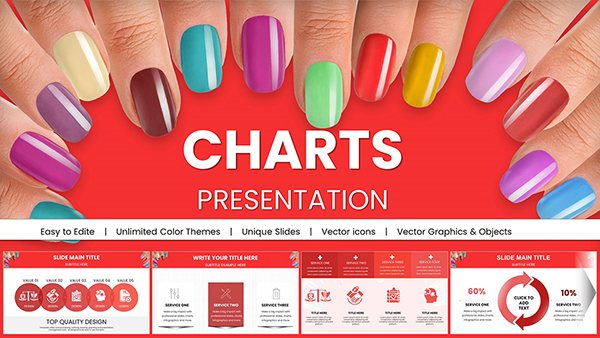
Project planning demands tools that clarify complexity, and our PowerPoint chart templates rise to the challenge. Geared toward coordinators, executives, and teams who rely on Microsoft Office, these designs offer intuitive ways to depict schedules, allocations, and forecasts. Say goodbye to cluttered spreadsheets and hello to slides that propel discussions forward.

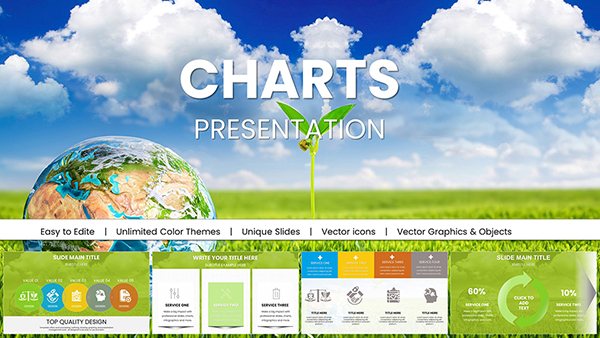
Our library boasts 45+ versatile charts, from stacked bars for resource tracking to scatter plots for risk assessment. Each is crafted with PowerPoint`s robust features in mind, including smart art integration and theme synchronization for brand consistency. Whether coordinating a corporate merger or a community initiative, these charts make milestones memorable.

Enhance collaboration with shareable files that update in real-time via OneDrive. Fuel your planning with precision - explore our selection and map out success today.


View by: Last Added | Most Popular
  • like 4
    (1006)
    Analytical Trend PowerPoint Charts: Decode Data with Precision
    ID: #PC01064
    $22.00
  • like 4
    (251)
    Presentations with Drone IT Technology PowerPoint Charts
    ID: #PC01052
    $25.00
  • like 4
    (571)
    Virtual World Mask PowerPoint Charts: Futuristic Visions Unleashed
    ID: #PC01042
    $18.00
  • like 5
    (466)
    Medical Science PowerPoint Charts: Illuminating Health Data with Clarity
    ID: #PC01040
    $20.00
  • like 3
    (118)
    Marketing PowerPoint Charts: Fueling Strategic Storytelling
    ID: #PC01038
    $20.00
  • like 3
    (960)
    Comprehensive Legal Acts PowerPoint Charts for Professionals
    ID: #PC01033
    $25.00
  • like 5
    (630)
    Eco Planet PowerPoint Charts for Green Innovation
    ID: #PC01029
    $18.00
  • like 3
    (1072)
    Conservation Ecology PowerPoint Charts: Empowering Environmental Insights
    ID: #PC01028
    $18.00
  • like 5
    (3)
    Comprehensive Marketing Strategies PowerPoint Charts: Data-Driven Mastery
    ID: #PC01026
    $22.00
  • like 4
    (837)
    Top Marketing Ideas: PowerPoint Charts for Strategic Wins
    ID: #PC01022
    $15.00
  • like 2
    (946)
    Manicure PowerPoint Charts Presentation Template
    ID: #PC01009
    $25.00
  • like 4
    (923)
    Oil and Gas Extraction PowerPoint Charts Template
    ID: #PC01007
    $22.00
  • like 2
    (925)
    Dynamic Startup PowerPoint Charts Template: Launch Your Ideas with Impact
    ID: #PC00930
    $24.00
  • like 5
    (608)
    Create Stunning Success Charts for PowerPoint Presentations
    ID: #PC00927
    $24.00
  • like 4
    (569)
    Drive Business Success with Targeted PowerPoint Chart Mastery
    ID: #PC00911
    $22.00
  • like 5
    (97)
    Inbound Marketing Process PowerPoint Charts Template: Streamline Your Strategy
    ID: #PC00882
    $15.00
  • like 5
    (623)
    Information Visualization PowerPoint Template
    ID: #PC00876
    $19.00
  • like 2
    (873)
    Marketable Basket PowerPoint Charts Template for Professional Presentations
    ID: #PC00853
    $20.00
  • like 3
    (559)
    Education Books PowerPoint Charts Template
    ID: #PC00843
    $15.00
  • like 5
    (652)
    4CS and 7PS Marketing Mix PowerPoint Charts Template
    ID: #PC00833
    $15.00
  • like 4
    (597)
    Vision, Mission, and Targets PowerPoint Charts Template: Empower Your Strategic Narrative
    ID: #PC00783
    $22.00
  • like 3
    (807)
    Dynamic Margin Analysis PowerPoint Charts: Unlock Business Insights with Precision
    ID: #PC00770
    $22.00
  • like 3
    (182)
    Periods Cycle PowerPoint Charts Template: Revolutionize Architectural Data Storytelling
    ID: #PC00759
    $18.00


Superiority of Our PowerPoint Project Charts

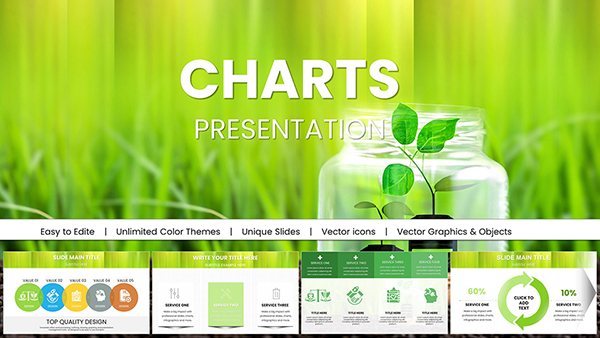
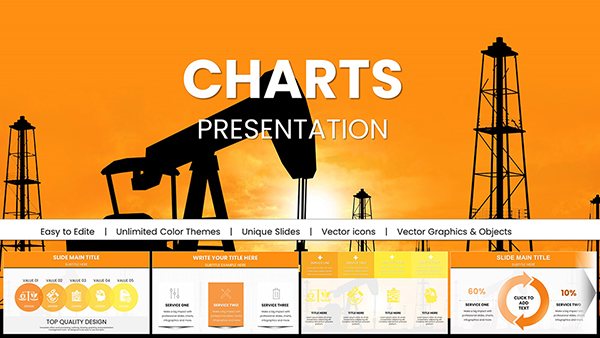
Default PowerPoint charts can feel rigid, but ours infuse creativity with modular components - like adjustable milestones in a single click. A budget pie chart, for instance, auto-calculates percentages, outpacing manual builds. They excel in multi-user scenarios, where version control prevents overlaps.

Emphasis on accessibility: high-contrast options and alt-text ready elements ensure inclusivity. This thoughtful design elevates standard visuals to strategic assets.

Diverse Applications in Project Scenarios

  • Product Launches: Line charts forecasting market entry phases.
  • HR Initiatives: Organizational charts for team restructuring.
  • Research Projects: Flow diagrams sequencing experiments.
  • Sales Strategies: Funnel visuals for pipeline management.

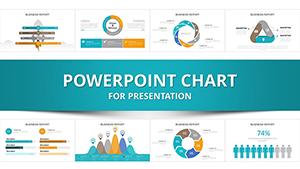
Creative professionals repurpose them for portfolio timelines, while educators craft lesson progress trackers. In fast-paced startups, they facilitate agile retrospectives with minimal setup.

Optimization Strategies for Charts

Prioritize simplicity: limit data points per slide to avoid overload. Utilize PowerPoint`s morph transition for smooth evolutions between charts. Embed hyperlinks to source data for transparency, and rehearse with presenter view for seamless delivery.

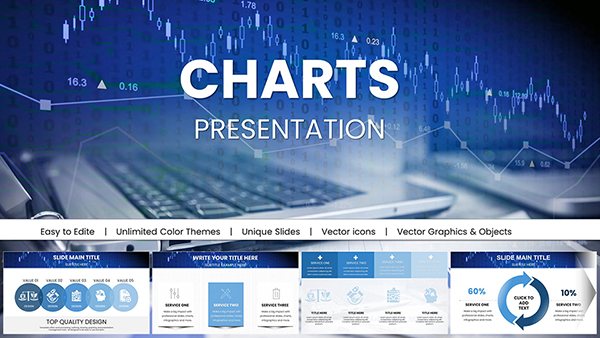
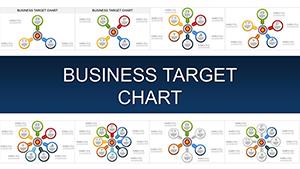
Envision a logistics firm using our Gantt chart to optimize routes, slashing delays by 25%. These narratives reveal how visuals forge paths to efficiency.

Empower Your Planning Workflow

Scan our charts for the ideal match and integrate immediately. With quick downloads, productivity surges from the outset. Secure your chart template and orchestrate flawless execution.

Frequently Asked Questions

These charts transcend decoration - they`re blueprints for achievement. Navigate uncertainties with visuals that unite and inform. Venture into our full range for comprehensive project mastery.

Transform planning from task to triumph with designs that deliver undeniable value.