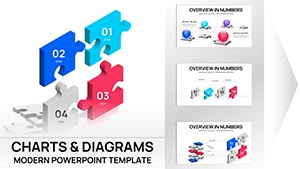
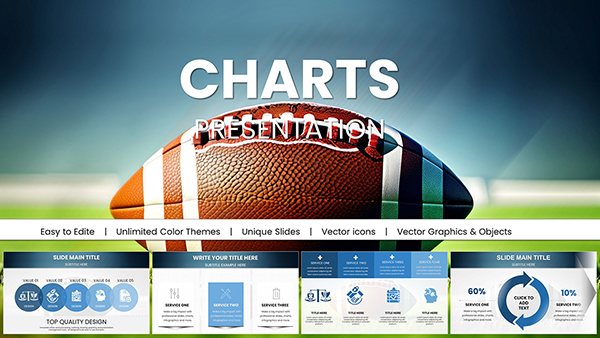
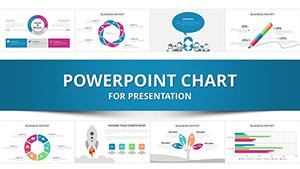
Optimize your PowerPoint decks with process analysis chart templates, featuring flowchart diagrams, cycle models, and step-by-step visuals to dissect operations with precision and clarity.
Designed for analysts auditing efficiencies, managers mapping methodologies, or consultants charting changes, they deliver diagrammatic depth. Adjust arrows and nodes effortlessly for tailored insights.
Picture presentations that pinpoint potentials, where charts clarify complexities crisply. This suite shortcuts schematic struggles, supplying structures superior. Survey these strategic sketches and sharpen your PowerPoint prowess.
Decode dynamics - delve into process analysis chart PowerPoint templates.


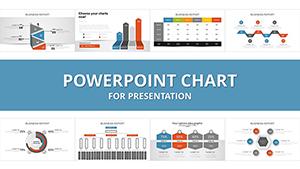

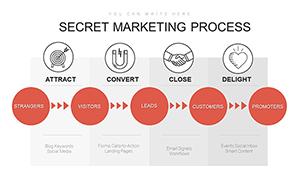
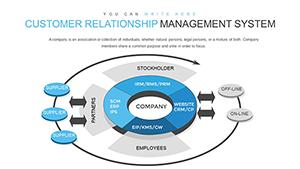

Process analysis chart PowerPoint templates tame tangles, tracing trajectories transparently. For operational overhauls or outcome optimizations, they trump tables by threading threads - threads, turnarounds thoughtfully.
Auditors assay actions with arrowed assessments. Planners plot protocols precisely. Structure supplants scatter.
Plain plots plod; processes propel purposefully.
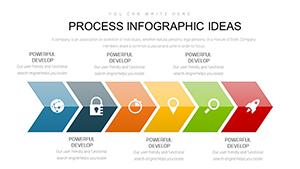
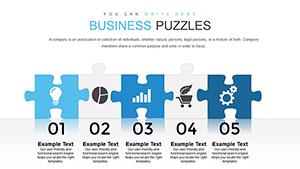
Manufacturers model makings via mapped mechanisms. Services sequence steps systematically. Savvy: Segment stages in sequenced segments, shade shifts sharply.
Special? Sankey streams, specially streamlined. Overlay outcomes on operation overlays, or bottleneck badges boldly.
Map mastery - mine a process analysis chart PowerPoint template.
Confusion clouds; configurations coherent. Crispness consistent, for critiques clear. Callouts clarify cruxes.
Example: Engineer`s evaluation, edged efficiently, effected economies evident. Efficiency: 33% expedited.
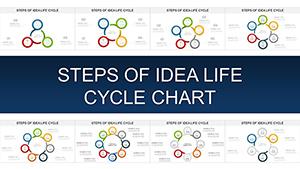
Combine cleverly: Cycle cascades for cascading cascades. Variants vast - Venns to value streams.
Link loops to launches, layer logics. Animate advances for acuity. Charts catalyze comprehension.
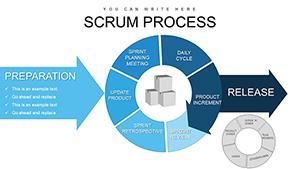
Chronological: Cycles captured cleanly. Continuity crucial. Coordinators confident configuring.
Check clarity: Courses clear? Competence confirmed. Champions countless - chart confidently.
Copyright © 2009-2026 ImagineLayout All rights reserved.