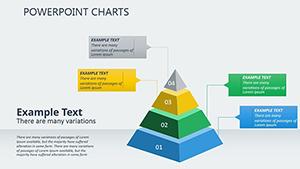
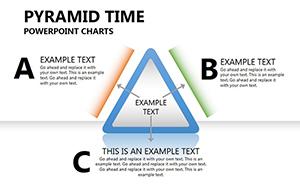
Revolutionize your PowerPoint slides with polyhedron charts that leverage three-dimensional polyhedrons to convey multifaceted information with elegance and clarity. From simple prisms to complex Archimedean solids, these templates provide a geometric canvas for data that demands more than flat representation.
Suited for scientists mapping molecular bonds, managers outlining organizational structures, or artists exploring form, they offer rotatable views and textured surfaces that engage viewers on multiple levels. Easily insert charts, metrics, or narratives into each polyhedral face, creating a comprehensive yet concise overview.
Powered by PowerPoint`s robust animation tools, these designs support morph transitions that simulate real-time manipulations, making abstract concepts accessible and exciting. Whether for webinars or printed reports, they deliver professional polish.
Construct compelling visuals: Browse polyhedron PowerPoint charts and elevate your storytelling today.


In corporate training, polyhedron charts dissect leadership competencies, with each face dedicated to skills like communication or resilience - morphs reveal growth paths dynamically. Geologists use them for rock formation models, vertices pinpointing mineral compositions for field report enhancements.
Product managers visualize feature roadmaps on elongated polyhedrons, stretching timelines across edges to show phased rollouts. In motivational speaking, coaches employ them for goal-setting, encasing personal milestones in a central sphere that expands with progress markers.
Basic PowerPoint charts confine data to predictable pies and lines, struggling with volumetric relationships that polyhedrons naturally embody. Our templates introduce bevel extrusions and gradient fills for lifelike rendering, far surpassing the planar limits of defaults.
Collaboration thrives with cloud-linked edits, where teams rotate shared models in real-time. Unlike generic shapes prone to alignment issues, these snap to geometric accuracy, streamlining workflows. Accessibility features like descriptive hyperlinks ensure voice-over compatibility.
Engagement metrics soar as audiences interact mentally with the depth, transforming routine briefings into immersive experiences.
| Capability | Polyhedron Charts | Standard Diagrams |
|---|---|---|
| Visual Depth | Extruded forms | Layered 2D |
| Manipulation | Morph animations | Basic fades |
| Precision | Auto-snapping | Manual adjusts |
Choose solids based on facet count - fewer for quick scans, more for detailed dives. Employ entrance animations to assemble from vertices outward, mirroring construction logic. Calibrate textures to theme relevance, like wireframes for tech talks or solids for creative pitches.
Performance tune by segmenting complex models across slides, avoiding overload in large decks. Solicit feedback loops: preview rotations in slideshow mode to refine pacing. Integrate with Excel for live data pulls, keeping charts evergreen.
Pro advice: Use negative space around polyhedrons to amplify their sculptural presence.
A biotech startup illustrated drug interactions via a buckyball polyhedron, carbon atoms as vertices pulsing with efficacy data - the demo secured venture funding. Urban planners mapped city zoning on a stellated dodecahedron, facets glowing with demographic insights for council approvals.
In workshops, facilitators used rhombicuboctahedrons for conflict resolution models, edges bridging opposing views to facilitate breakthroughs. Jewelry designers prototyped gem cuts, facets showcasing refraction simulations for client previews.
Form your narrative: Download a polyhedron PowerPoint chart and geometrize your message.
Copyright © 2009-2026 ImagineLayout All rights reserved.