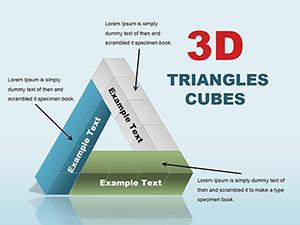
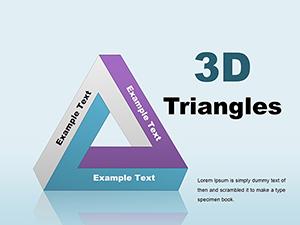
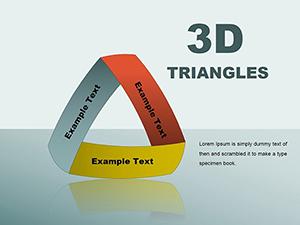
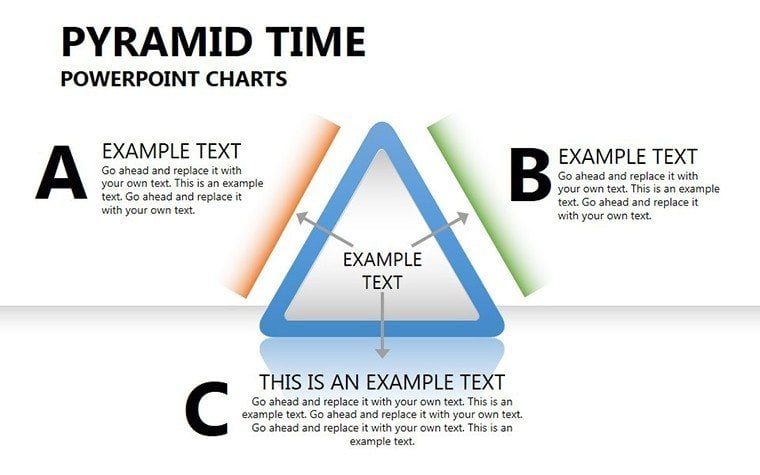
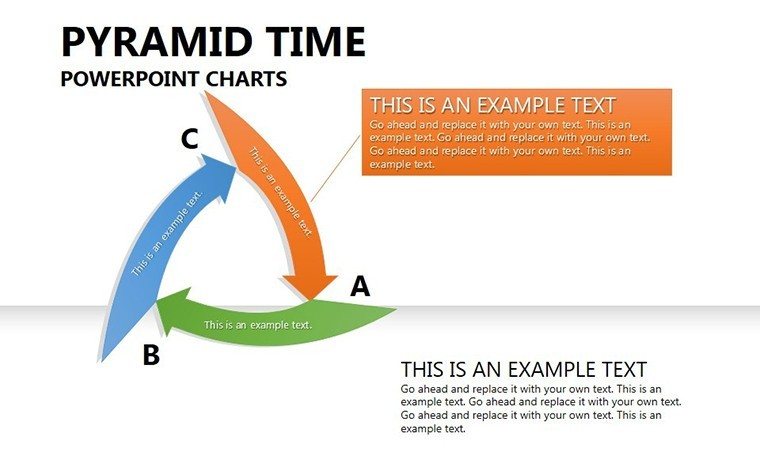
Pyramid Times PowerPoint Charts: Layer Legacies in Every Slide


Type: PowerPoint Charts template
Category: Pyramids
Sources Available: .pptx
Product ID: PC00265
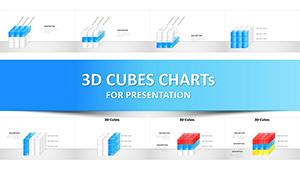
Template incl.: 20 editable slides
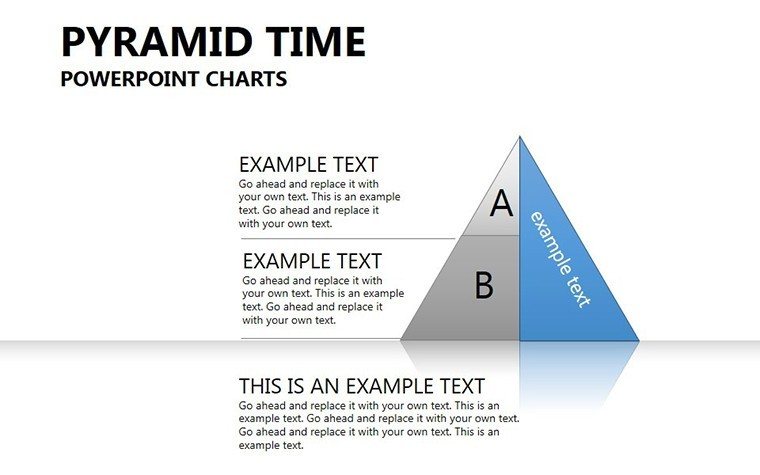
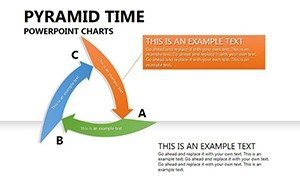
Hierarchies aren't flat - they ascend, inspire, and illuminate. Our Pyramid Times PowerPoint Charts Template captures that ascent across 20 editable slides, a summit for executives, marketers, and educators scaling complex concepts into climbable narratives. This isn't stacking blocks; it's architecting arguments where base data broadens to pinnacle insights, turning timelines into triumphs.
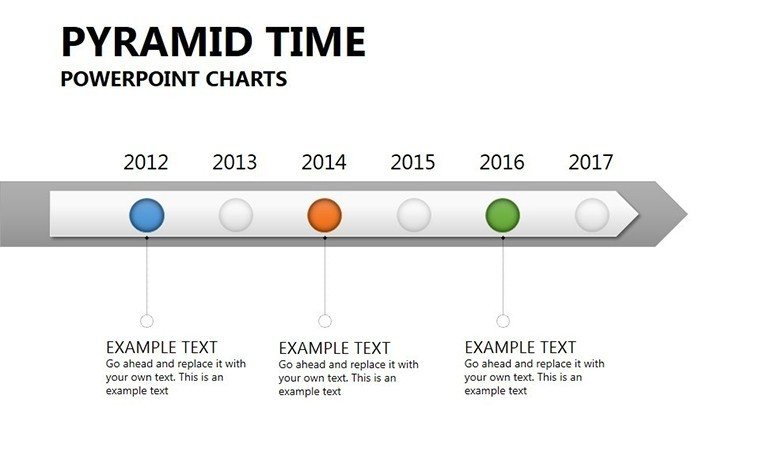
Geared for strategy sessions or seminar spotlights, pyramids here chart project phases or org evolutions, with time-infused tiers for chronological clarity. PowerPoint and Google Slides attuned, it accommodates apex annotations from tools like Asana. Mirroring masons of management, like Maslow's motivational pyramids repurposed for biz, we've woven temporal threads for enduring elevation.
Why ascend? Structured visuals lift retention 65% (per Gestalt principles), forging paths from perplexity to proficiency. For proposals or pedagogies, it's your elevation engine. Summit the sections below.
Peak Features: Pyramids Poised for Your Plot
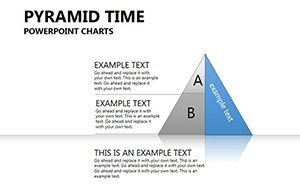
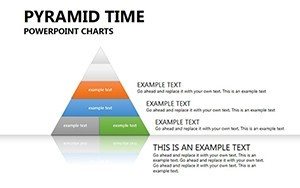
Atop the 20 slides: Total tweakability - widen bases for broad contexts or taper tips for targeted takeaways, all crisply contoured.
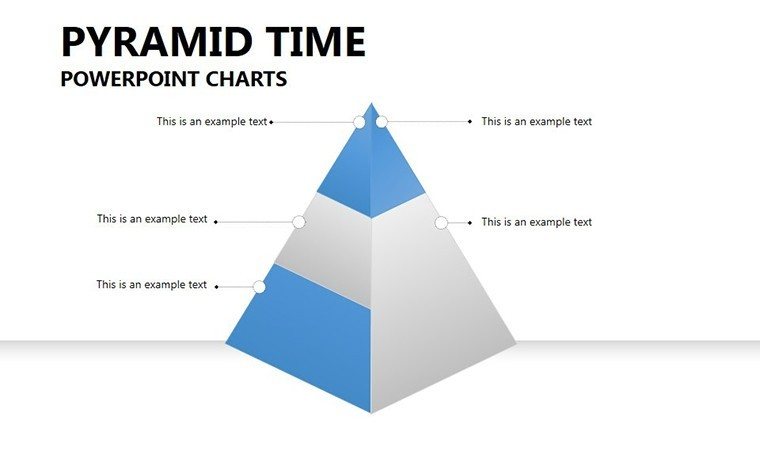
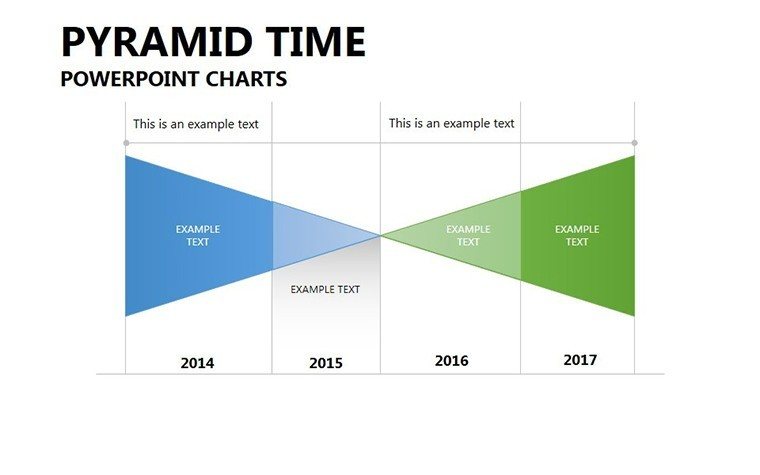
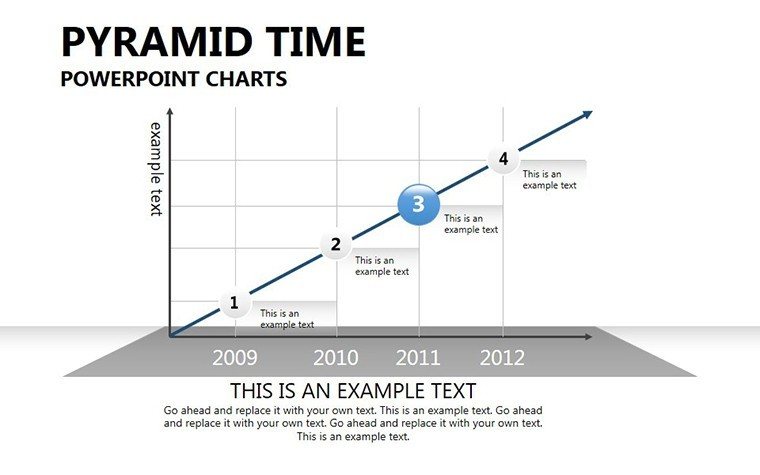
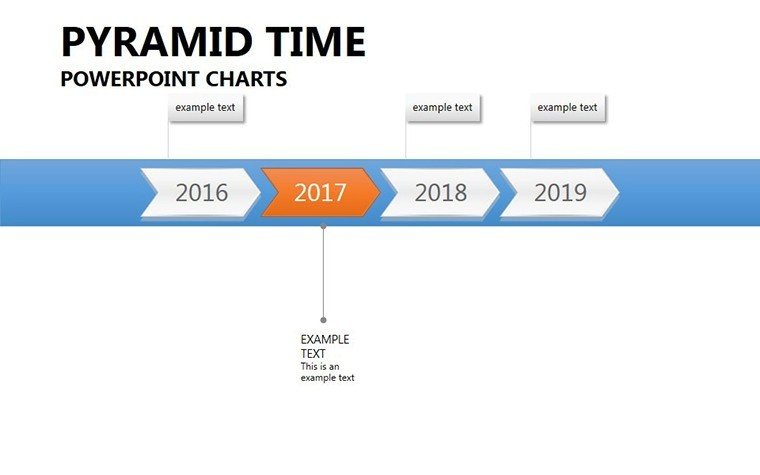
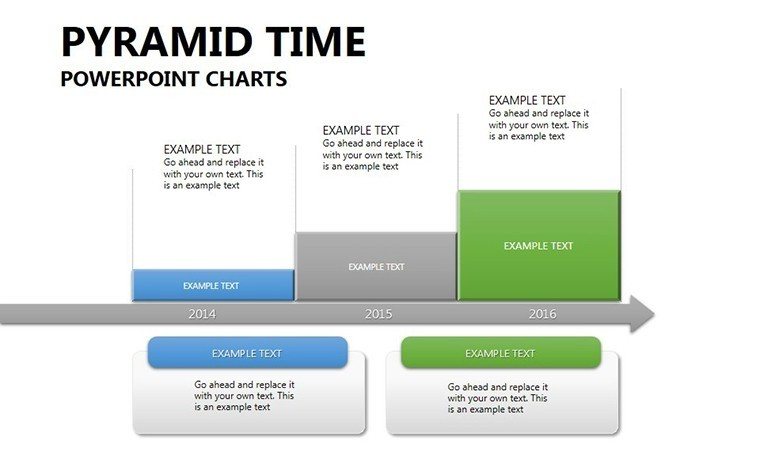
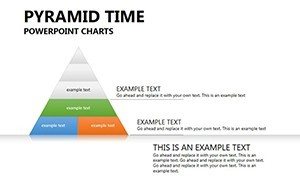
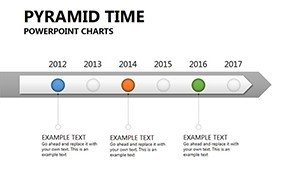
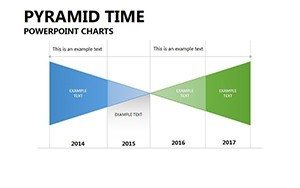
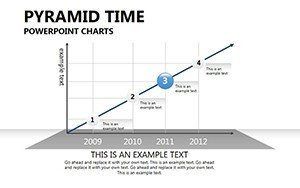
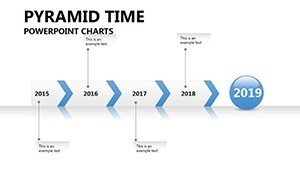
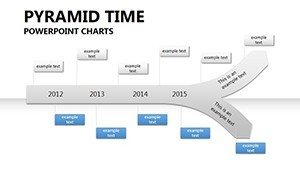
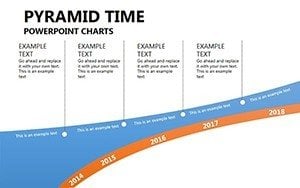
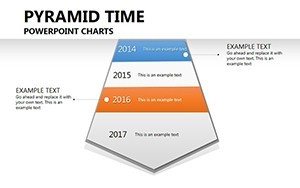
- Timeline Pyramids: Stack eras, from inception bases to milestone peaks, tracing evolutions elegantly.
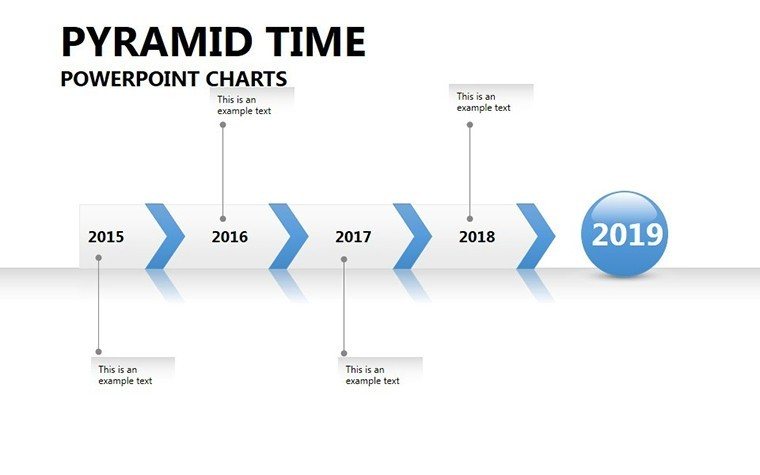
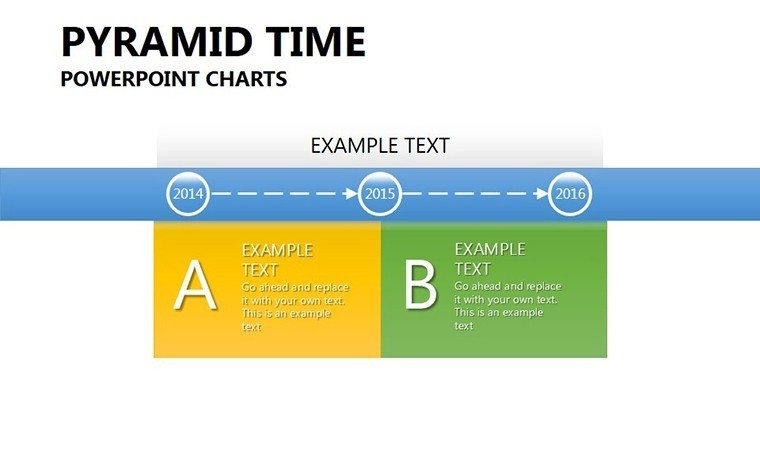
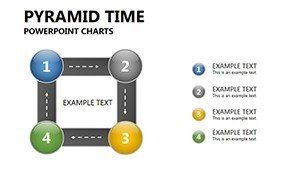
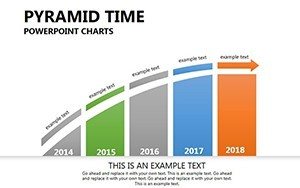
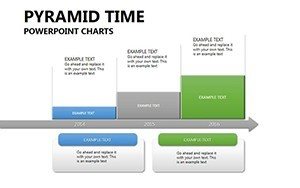
- Hierarchy Bars: Layer roles or risks, with temporal tags for phased progressions.
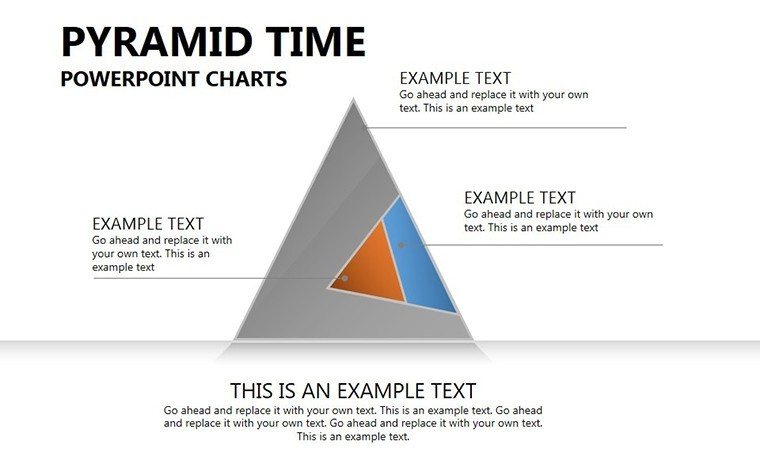
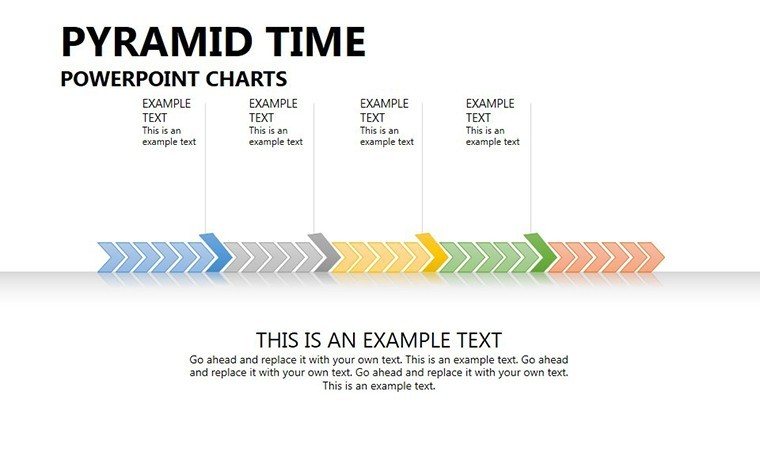
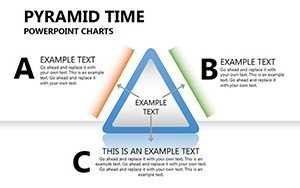
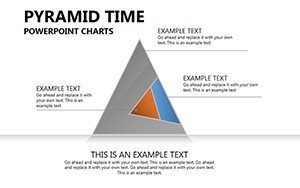
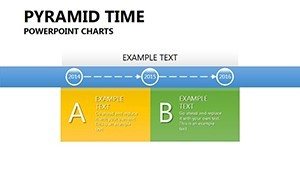
- Custom Cascades: Flow from foundational facts to visionary vertices, visually voicing visions.
Palette plays? Personalized. Transitions? Tiered for gradual gains.
Versatile Vistas: From Corp Climbs to Class Constructs
Org redesigns? Pyramids plot personnel paths, prioritizing promotions. Lecture ladders? Animate for ascending arguments in lit reviews.
Resonance: McKinsey analogs layer such for 35% leaner leadership. Strategists? Time-base for roadmap renders.
- Base Your Build: Feed from Gantt exports - layers lock logically.
- Tier Tones: Shade gradients for time gradients, syncing schemes.
- Apex Animations: Unveil from bottom-up for building buys.
- Peak & Publish: Formats flex for forums or files.
Protocol propels productivity, per pyramid pros.
Above Average Arcs
Plain polygons? Pedestrian. Ours? Period-punctuated, with epoch icons and LSI lifts - "timeline pyramid visuals," "hierarchy time charts."
Access? Adaptive contrasts, tagged trails.
Ascent Aids for Apex Achievers
Pro: Peripheral paths on flanks for side stories. Jest: "This pyramid's pointier than our KPIs!" Meld with TimelineJS for temporal twists.
As a structure scribe for strat firms, I summit: These layer lasting lore.
Scale New Summits: Acquire the Template
Pyramids beckon. Procure Pyramid Times PowerPoint Charts Template - prompt peaks, perpetual poise. Download forthwith to tower tales.
Frequently Asked Questions
Optimal for timeline hierarchies?
Yes, pyramid tiers track time superbly.
Slides compatibility?
Google too, gradients guarded.
Data layering ease?
Drag-drop depths, dynamic.
Anim for ascents?
Yes, sequential summits.
Edu or exec fit?
Dual-duty for discourses or directives.
Time-scale tweaks?
Flexible for fiscal or full years.