Gantt Timeline PowerPoint Chart Template: Visualize Project Success


Type: PowerPoint Charts template
Category: Timelines
Sources Available: .jpg, .pptx
Product ID: PC00256
Template incl.: 14 editable slides
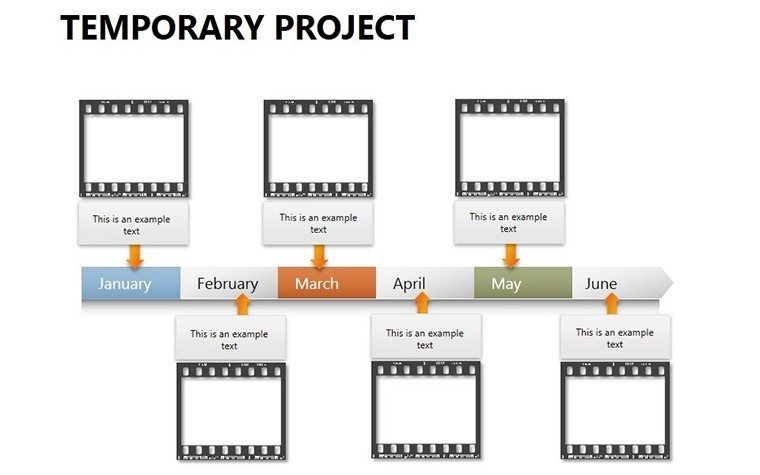
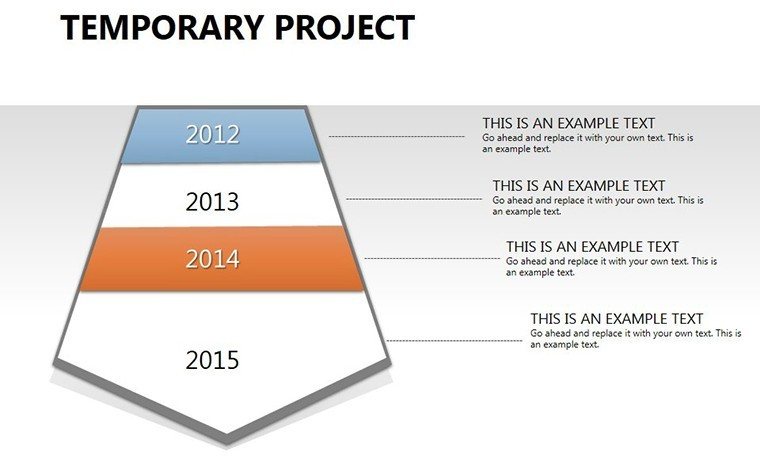
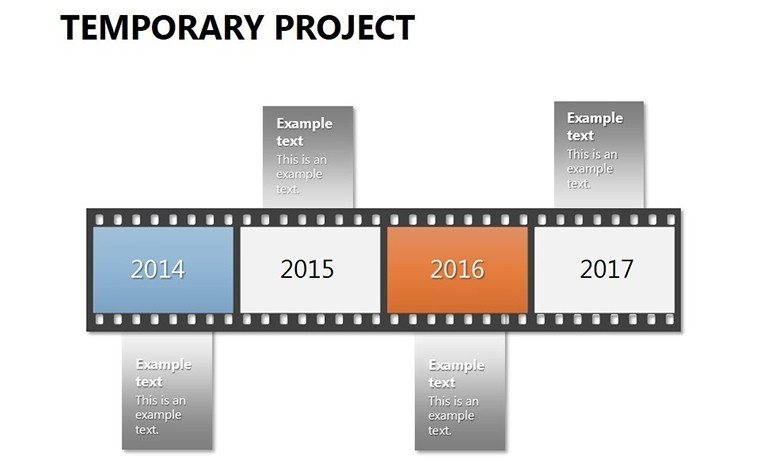
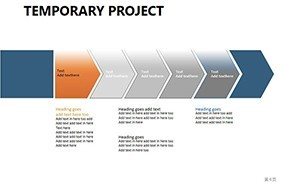
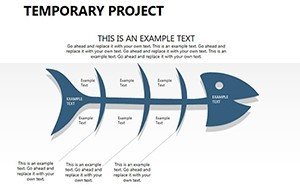
Project management thrives on clarity, and our Gantt Timeline PowerPoint Chart Template delivers just that. With 14 editable slides, it's crafted for managers overseeing tasks from inception to completion, using strips to denote durations across various time units. Ideal for construction leads or software devs, it turns chaotic schedules into organized visuals, ensuring teams stay aligned and deadlines met.
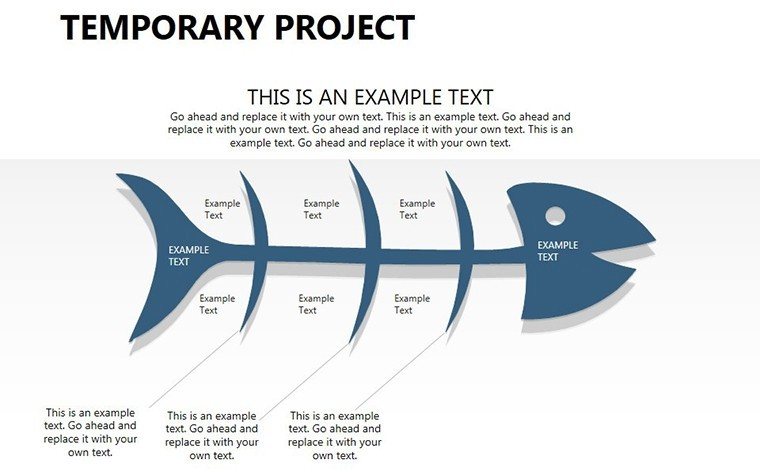
Picture mapping a product launch where dependencies overlap seamlessly, highlighting potential bottlenecks early. Compatible with PowerPoint and Google Slides, this template integrates into tools like MS Project for enhanced functionality.
Essential Features for Efficient Planning
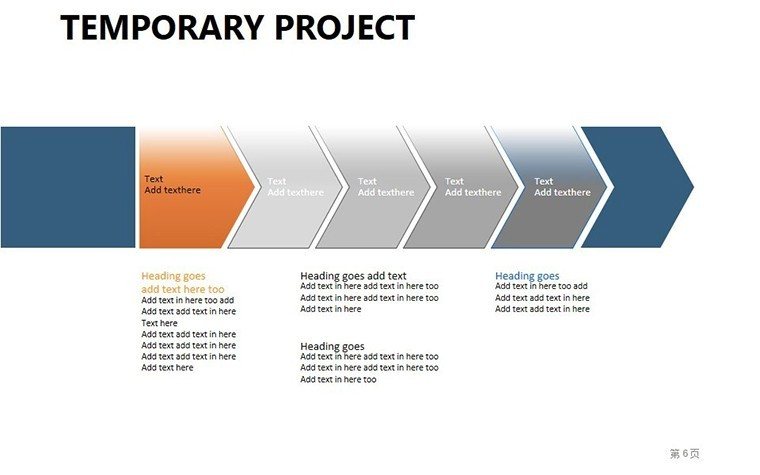
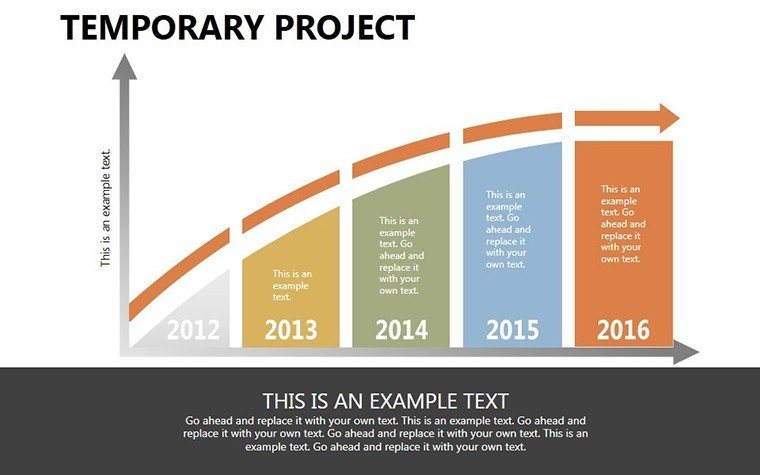
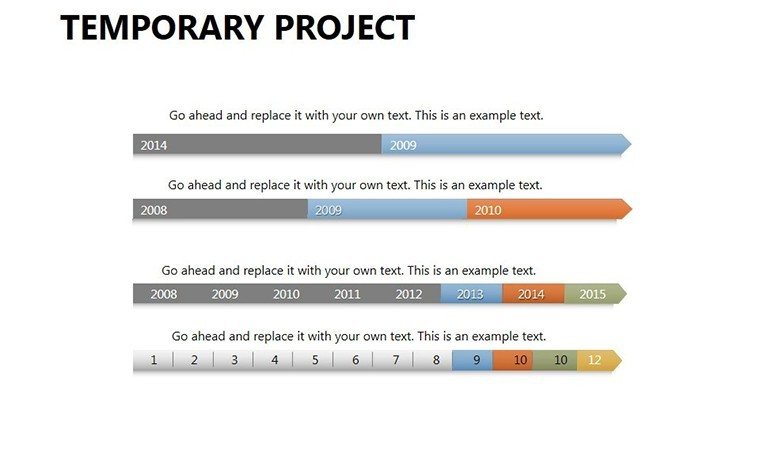
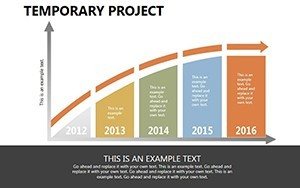
Slides vary from basic Gantt overviews (slide 1) to detailed multi-phase views (slide 9), with adjustable timelines.
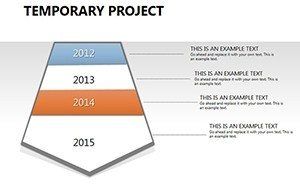
- Flexible Time Units: Switch between days, weeks, months effortlessly.
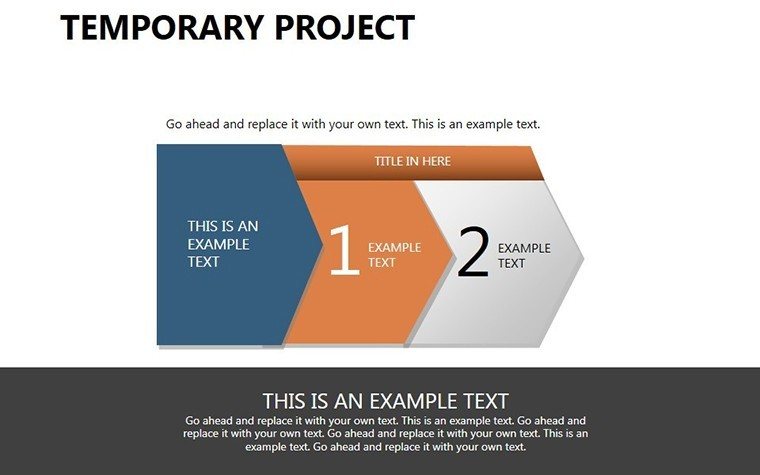
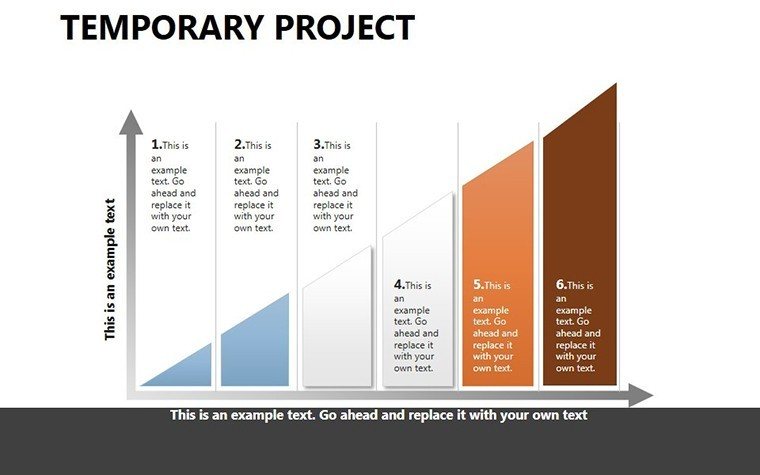
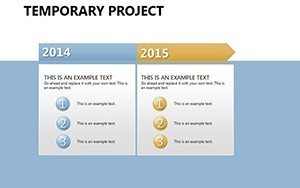
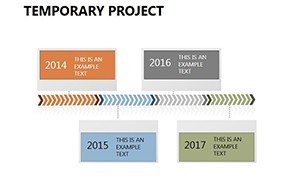
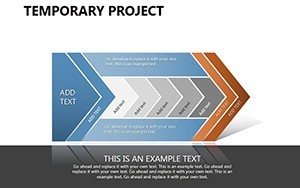
- Task Strips: Color-code for priority and status tracking.
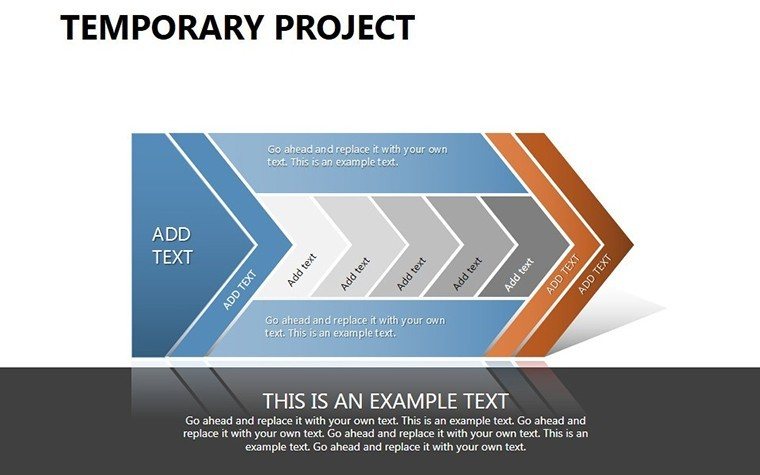
- Dependency Links: Visualize interconnections to avoid delays.
- Milestone Markers: Highlight key achievements.
Aligned with PMBOK guidelines, these ensure robust project oversight.
Application Scenarios and Implementation Steps
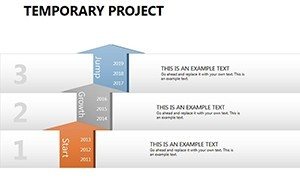
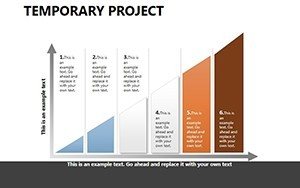
In urban planning, use slide 5 to timeline infrastructure phases, akin to ASCE case studies showing 20% efficiency gains. For IT, slide 12 tracks sprints in agile setups.
Workflow: 1. List tasks and durations. 2. Assign strips. 3. Adjust scales. 4. Share for reviews. Superior to native PowerPoint Gantts, offering more granularity.
Pro Tips for Timeline Mastery
As a marketing analyst, I recommend buffer zones in timelines to handle uncertainties, per risk management best practices. Integrate with calendars for real-time updates.
This template's adaptability saves hours, fostering proactive management.
Elevate Your Project Narratives
Empower your team with visuals that communicate progress clearly. Secure your edge - customize this Gantt template now.
Frequently Asked Questions
- How do I change time units?
- Easily via display mode options.
- Compatible with Google Slides?
- Yes, upload and edit seamlessly.
- Can I add dependencies?
- Absolutely, with built-in links.
- Suitable for large projects?
- Scalable for complex timelines.
- Are there color options?
- Fully customizable palettes.
- Export formats?
- PPTX, JPG, and more.