Dive into our specialized selection of policy Keynote charts, engineered to simplify the communication of complex regulations and guidelines. Perfect for HR professionals, legal teams, and compliance officers, these charts turn dense policy documents into accessible, visually striking overviews that promote understanding and adherence.
From organizational hierarchies to risk assessment matrices, each chart is meticulously designed with clean lines, intuitive color coding, and scalable vectors for sharp displays on any screen. Benefit from templates that not only inform but also inspire confidence in your audience, whether in boardrooms or training sessions.
Our collection emphasizes practicality, offering quick edits to fit specific policies like data privacy or workplace safety. Elevate your next policy review with tools that make expertise shine. Browse now and secure downloads that deliver immediate value.
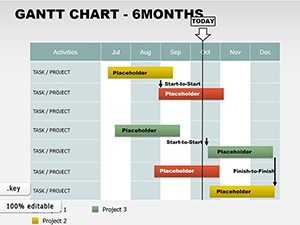
Navigating corporate policies requires precision, and our policy Keynote charts provide the visual backbone for effective dissemination. In HR settings, use stacked bar charts to illustrate employee benefits distribution, highlighting equity and coverage gaps. Legal advisors can leverage flowchart diagrams to map out contract review processes, ensuring all stakeholders grasp the workflow at a glance.
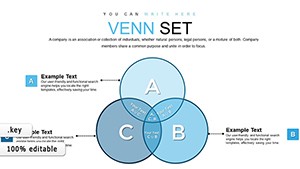
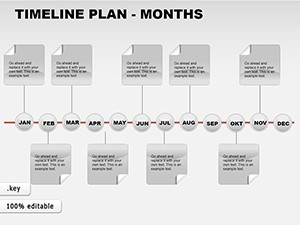
For governance meetings, donut charts effectively depict compliance rates across departments, with customizable segments for drill-down details. These applications extend to educational seminars, where animated line graphs track policy evolution over time, fostering deeper engagement.
In onboarding programs, these charts accelerate learning by visualizing code of conduct hierarchies, with interactive tooltips for definitions. Compliance training benefits from scatter plots correlating policy adherence with performance outcomes, providing empirical motivation.
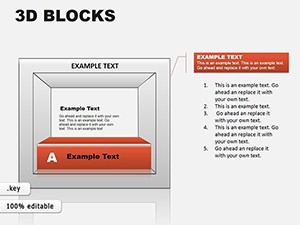
Standard Keynote charts often lack the depth needed for policy nuances, appearing generic and uninspiring. Our versions stand out with policy-centric icons - think padlocks for security or scales for ethics - and layered data representations that reveal insights at varying depths. This elevates discussions from rote recitals to strategic dialogues.
Moreover, they`re built for collaboration: shareable links allow team edits without version conflicts, and export options support PDF or image formats for printed handbooks.
Begin with audience analysis: for executives, opt for high-level summaries; for staff, detailed breakdowns. Employ consistent color schemes - reds for risks, greens for approvals - to reinforce messaging subconsciously. Integrate hyperlinks to full policy texts for seamless navigation.
Advanced technique: Use Keynote`s magic move for transitions between chart states, illustrating policy updates dynamically. Regularly update data sources to keep charts current, maintaining trust in your visuals.
A compliance officer might deploy a bubble chart to size risks by impact and likelihood, with policies as quadrants guiding mitigation. In a diversity initiative, a treemap displays representation stats, enabling targeted discussions. Or, for remote work policies, a heatmap charts productivity patterns, informing flexible guidelines.
These examples highlight how our charts spark innovation, turning compliance into a competitive edge.
Empower your policy communications with our ready-to-use Keynote charts. Select from the library and start customizing - your path to clearer, more compelling presentations awaits.
Copyright © 2009-2026 ImagineLayout All rights reserved.