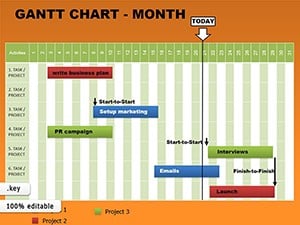
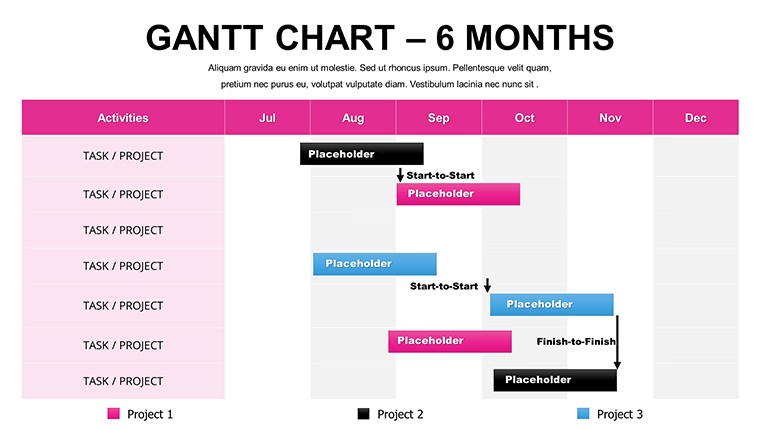
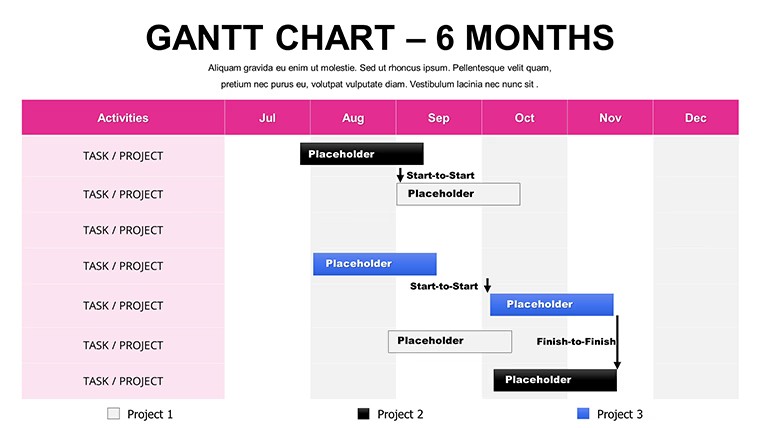
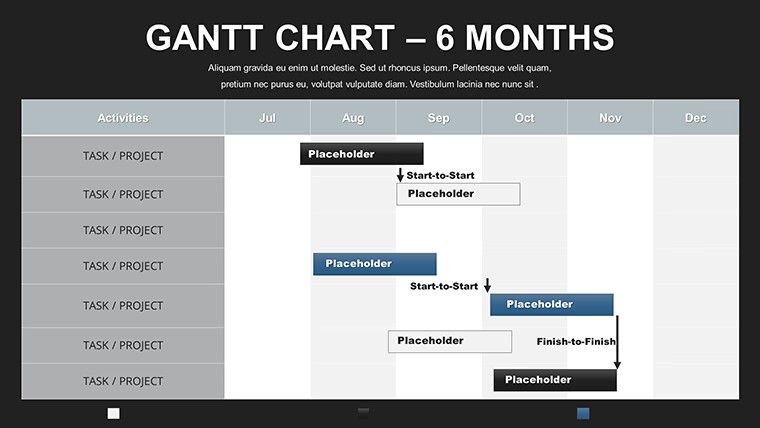
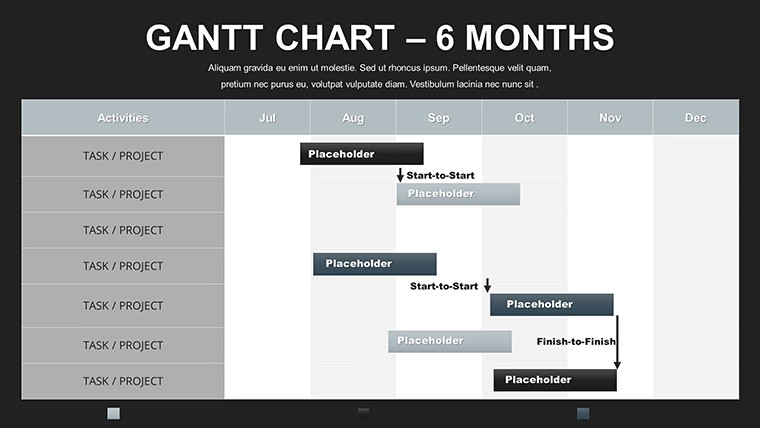
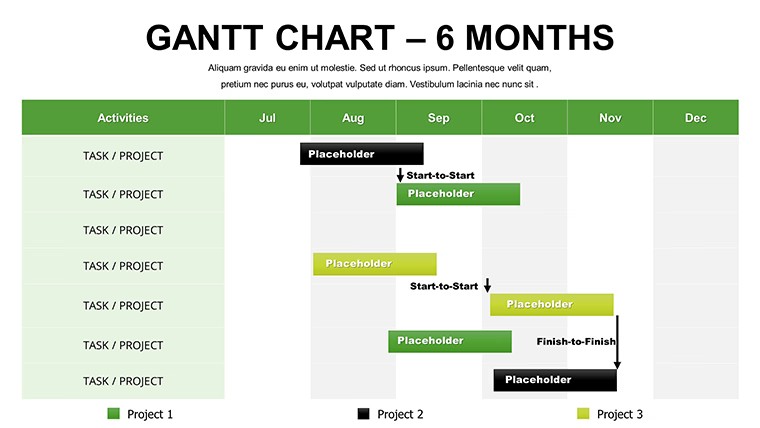
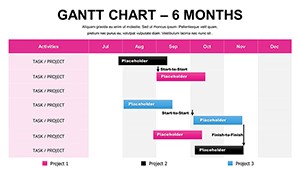
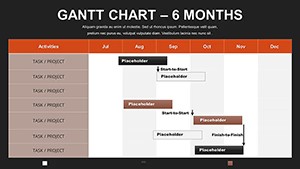
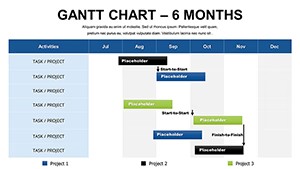
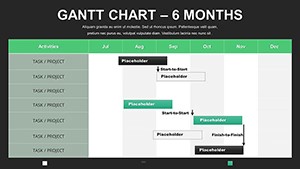
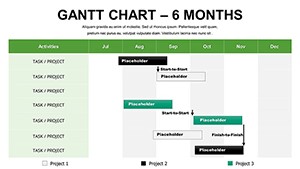
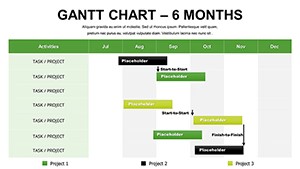
6-Month Gantt Keynote Template - Free & Editable


Type: Keynote Charts template
Category: Free Templates, Tables
Sources Available: .key
Product ID: KC00067
Template incl.: 12 editable slides
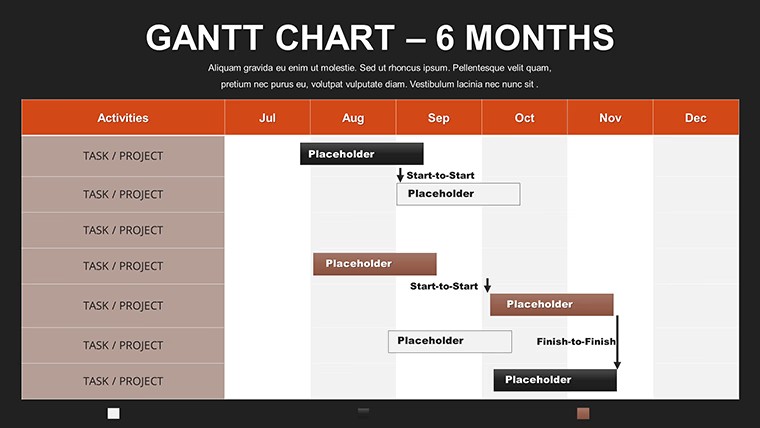
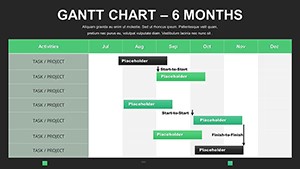
Picture this: six months of software sprints unfolding like a well-rehearsed symphony, where every code commit and feature drop hits its mark without a single sour note. Our 6-Month Gantt Keynote Template brings that harmony to your presentations, offering a free, robust toolkit for developers, product owners, and agile teams who crave clarity amid complexity. With 12 meticulously crafted, editable slides, this template isn't just a chart - it's a roadmap to releasing MVPs that turn heads and ship on schedule.
Crafted for Keynote's elegant ecosystem, it embodies agile methodologies from Scrum Alliance guidelines, segmenting your horizon into digestible quarters while spotlighting iterations. Developers love how it visualizes backlogs turning into deliverables, much like how a recent GitHub-integrated project at a fintech startup shaved weeks off deployment cycles. Say goodbye to fragmented tools; this template unifies your timeline, fostering discussions that propel innovation rather than stall it.
Discover the Standout Features Fueling Your 6-Month Vision
What sets this apart? It's the thoughtful details that anticipate your needs. Quarterly breakdowns with nested week views let you drill down from high-level epics to daily stand-ups, all in Keynote's fluid interface. Animate progress bars to simulate velocity charts, revealing burn-down trends that keep retrospectives insightful and action-oriented.
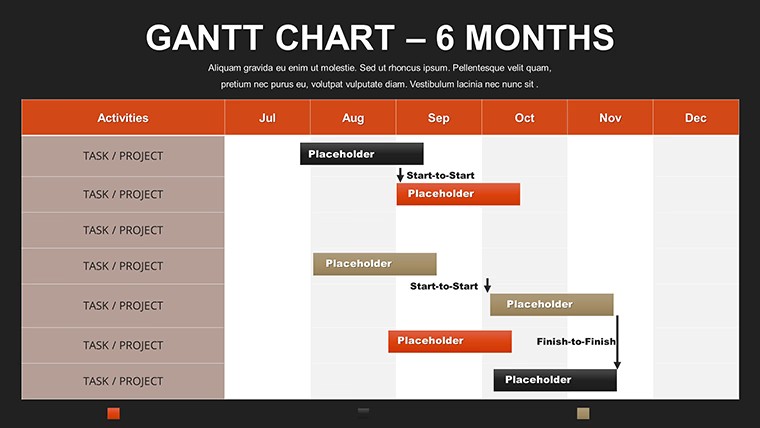
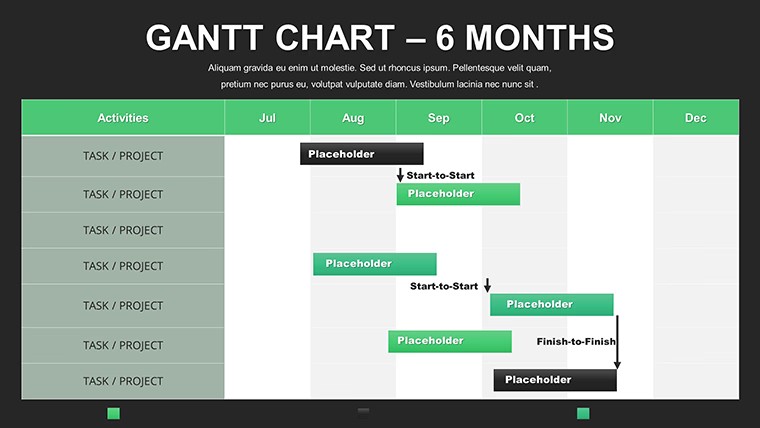
- Dynamic Bars and Legends: Resize tasks on the fly, color-code by sprint themes - like red for bugs, green for features.
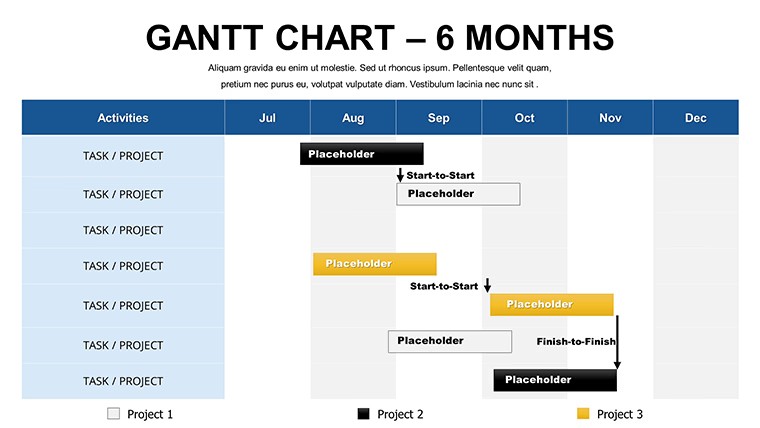
- Milestone Integration: Starburst markers for releases, complete with hyperlinks to Jira tickets for instant context.
- Scalable Layouts: From landscape epics to portrait summaries, adapting to any deck format.
- Built-in Samples: Pre-loaded dev cycle data to jumpstart your customization.
Versus basic timelines, this elevates with dependency arrows that flag risks early, a nod to critical path method (CPM) pros who've used it to optimize resource-heavy builds.
Transformative Benefits: Efficiency Meets Engagement
The payoff? Teams using similar visuals report 25% faster decision-making, per Harvard Business Review insights on visual aids. For software houses, it's the difference between a chaotic crunch and a controlled cadence, ensuring code ships polished and on-point.
Supercharging Development Teams
In the trenches of app dev, where pivots are the norm, this template shines by mapping user stories to timelines. Envision charting a mobile overhaul: Month 1 for UI prototypes, Month 3 for beta testing - all dependencies linked to prevent scope creep. Stakeholders grasp the "why" behind delays, turning potential friction into focused fixes.
Elevating Stakeholder Syncs
Export to video for remote demos, where animations breathe life into dry data. It's collaboration reimagined, with shared edits syncing across time zones, much like how distributed teams at open-source projects maintain momentum.
Practical Use Cases: Sprint into Action
Let's blueprint some blueprints.
- Software Release Cycle: Slides 1-4: Epic planning with velocity forecasts; animate to show iteration builds culminating in launch.
- Product Roadmap Review: Slides 5-8: Feature prioritization matrix overlaid on Gantt, highlighting ROI hotspots.
- Agile Retrospective: Slides 9-12: Post-sprint analysis with what-if scenarios, editable for ongoing refinement.
Insider hack: Pair with Keynote's smart guides for pixel-perfect alignments, ensuring your Gantt feels as engineered as the code it represents.
Effortless Integration into Your Dev Workflow
Grab the file, infuse with Trello exports, and iterate. Supports Keynote 12+, with tips for embedding live data pulls if you're feeling fancy. From ideation to iteration, it's your co-pilot for presentations that code for success.
This isn't mere management - it's momentum. Devs who've wielded it celebrate fewer overruns and more high-fives. Snag your 6-Month Gantt Keynote Template free today, and code the future with confidence that clicks.
Frequently Asked Questions
How does this template handle agile sprints?
With nested views for iterations, it mirrors Scrum boards, letting you track velocity and adjust on the fly for dev agility.
Are animations customizable?
Yes, tweak timings and triggers in Keynote to match your demo pace, enhancing live coding walkthroughs.
Can it import from tools like Jira?
Easily - paste CSV data for instant population, bridging your PM stack seamlessly.
What's the slide count?
12 versatile ones, expandable for custom epics.
Is it suitable for remote teams?
Perfectly, with cloud sharing for real-time collab across global dev hubs.