Navigate complex markets with our PEST analysis chart templates for PowerPoint, designed to simplify environmental scanning and reveal actionable insights. Tailored for strategists, consultants, and business leaders, these templates break down Political, Economic, Social, and Technological factors into clear, visual frameworks that drive informed decisions.
Whether preparing board reports or competitive analyses, our charts offer intuitive structures with color-coded segments, editable data inputs, and integrated legends for at-a-glance understanding. Transform abstract trends into concrete strategies, saving hours on manual diagramming.
From classic four-quadrant models to expanded PESTLE variants, our collection empowers you to adapt to any scenario. Start uncovering opportunities and mitigating risks today - explore and download to supercharge your planning sessions.


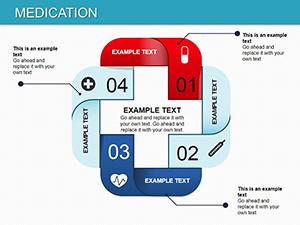
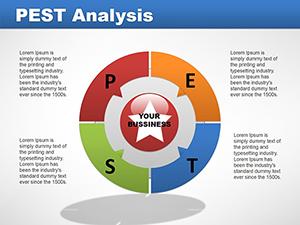
PEST analysis charts are vital for holistic business evaluation, and our PowerPoint templates streamline this process with drag-and-drop quadrants, auto-updating arrows for trend indicators, and customizable icons representing each factor. High-contrast visuals ensure readability in group settings, while exportable SVGs maintain quality in reports.
Consultants praise the time savings, allowing focus on interpretation over illustration.
These applications underscore their strategic value.
Basic PowerPoint charts lack the contextual depth for PEST; ours include pre-filled examples, interlinked data tables, and scenario sliders for what-if analyses, enabling dynamic explorations. This interactivity fosters deeper discussions and more robust strategies.
Compliance with data visualization standards like WCAG ensures equitable access.
Implement these for sharper insights.
A retail chain used our template to pivot during economic downturns, spotting social distancing trends early and shifting to e-commerce, boosting revenue 25%. Tech firms leverage them for innovation roadmaps, aligning R&D with policy changes.
Enhance with heat maps or SWOT integrations for comprehensive views.
Empower your strategy - download PEST chart templates and chart your course.
Layer in quantitative metrics with embedded formulas, creating live-updating charts. For global ops, multi-region variants compare cross-border factors, aiding expansion decisions.
In academia, they facilitate case studies, blending theory with real-world visuals.
Link to Excel for automated data pulls, or embed Tableau visuals for advanced modeling, elevating your analyses.
Strategic foresight starts here. Browse our PEST collection for transformative tools.
Copyright © 2009-2026 ImagineLayout All rights reserved.