Users Social Networks PowerPoint Charts - Download PPTX


Type: PowerPoint Charts template
Category: Tables
Sources Available: .pptx
Product ID: PC00347
Template incl.: 11 editable slides
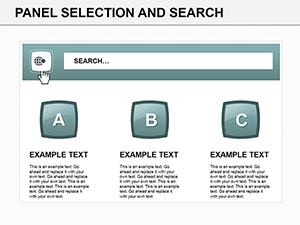
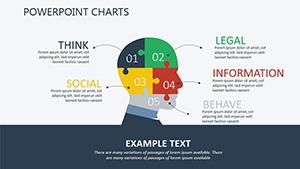
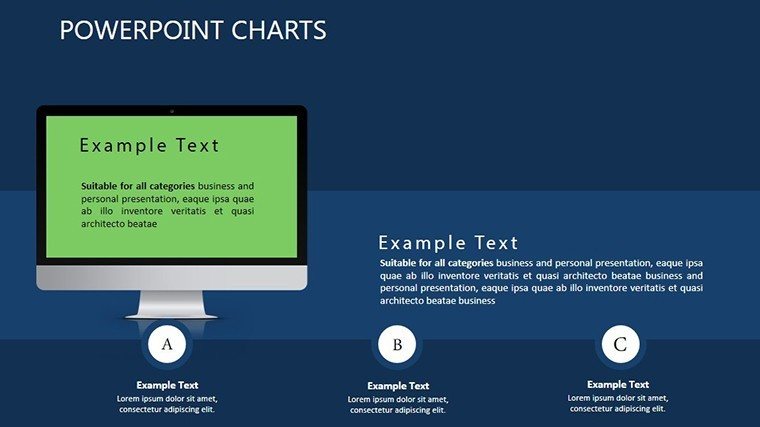
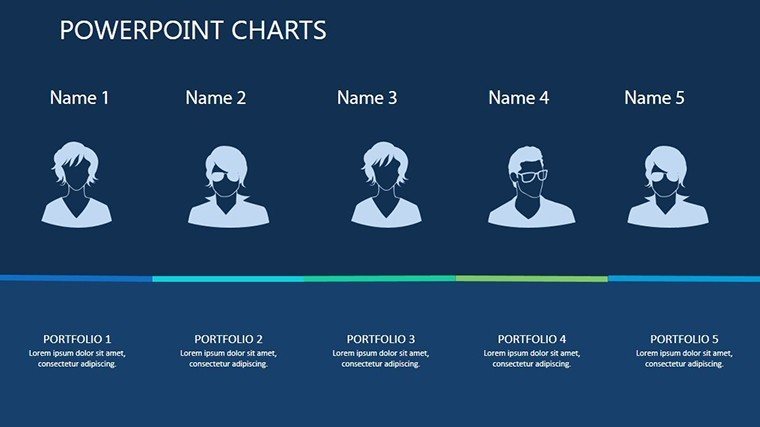
This Users Social Networks PowerPoint Charts template will help you show your social media data clearly and straightforwardly. It features a range of charts and graphs to help you track your progress, assess your outcomes, and spot patterns. Our social network-specific PowerPoint charts are excellent for visualizing and communicating your data.
Features of Our Social Networks PowerPoint Charts
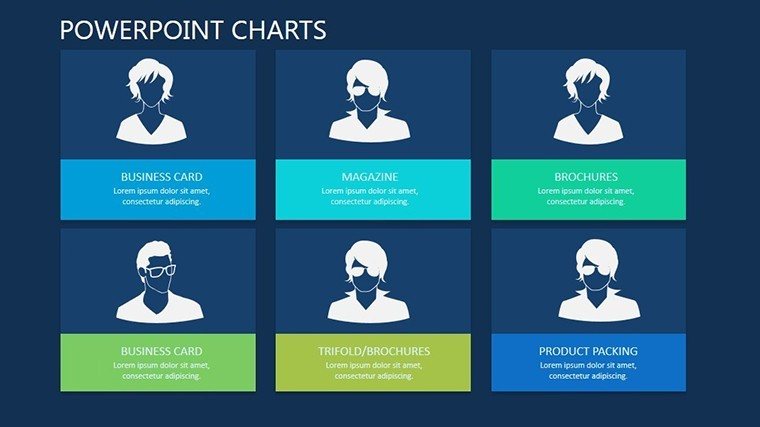
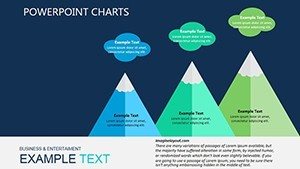
- Versatile designs: Our PowerPoint charts are available in several designs to meet different purposes. We offer charts showing Facebook metrics, Twitter interaction, and Instagram growth.
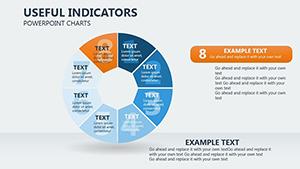
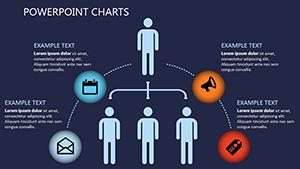
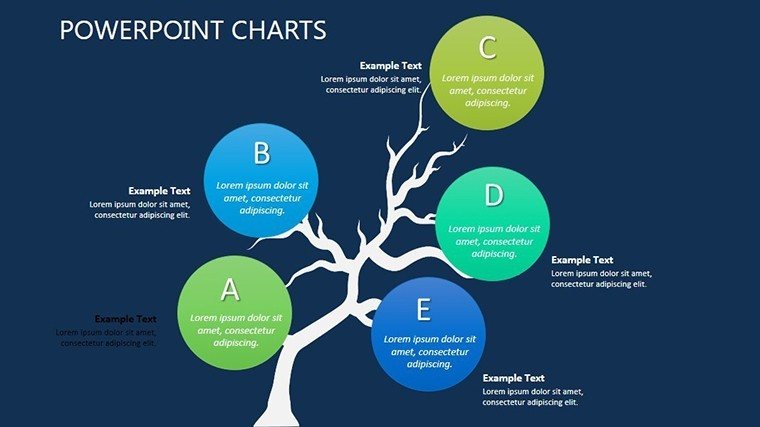
- Customizable templates: Tailor each chart to your unique needs. You may easily change the colors, fonts, and layouts to match your brand's identity.
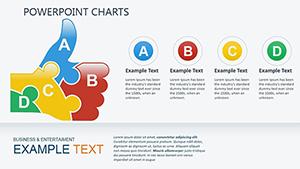
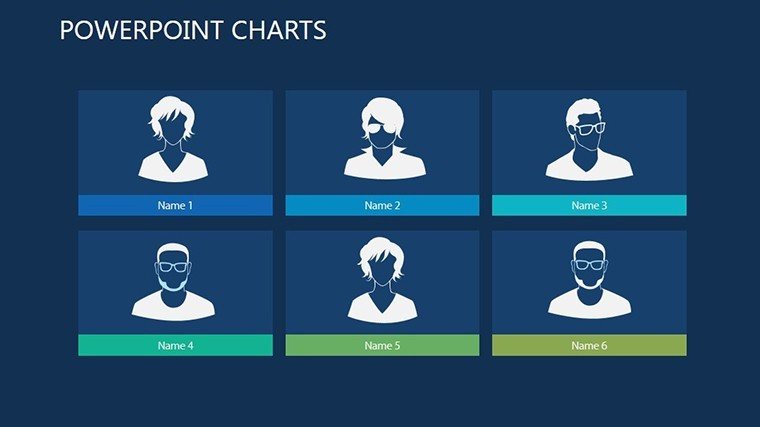
- Data-driven visuals: Import your data with ease and watch as our templates turn it into captivating visualizations. Clear, visually appealing charts may highlight trends, compare measures, and demonstrate growth.
- The interface is user-friendly. No design experience? Not an issue. Our templates are simple to use, allowing you to prepare excellent presentations in minutes.
Advantages of Using PowerPoint Charts on Social Networks
- Enhanced Understanding: Visual aids make difficult data more accessible and clear, allowing your audience to absorb crucial insights faster.
- Professional Appeal: Well-designed charts offer a professional touch to your presentations, making you appear polished and convincing.
- Time-Saving: Instead of spending hours on design, use ready-made templates to focus on data analysis and message creation.
Who Will Benefit From Our PowerPoint Charts?
- Marketers: Use clear, engaging images to demonstrate campaign effectiveness, audience engagement, and ROI.
- Business owners: Present your social media plans, growth numbers, and competitive analysis to stakeholders with confidence.
- Social media managers: Monitor and report on key performance metrics, recognize trends, and make data-driven choices.
- Educators and Trainers: Teach social media techniques, trends, and analytics efficiently by including visual aids.
Why Do You Need Our PowerPoint Charts?
Social networks are continuously changing, and keeping ahead demands a strong grasp of statistics. Our PowerPoint charts will assist you:
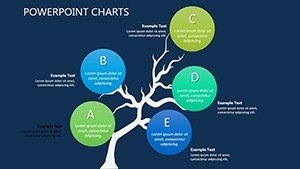
- Visualize Trends: Identify upcoming trends and capitalize on them before your competition.
- Communicate effectively: Use charts to deliver your information effectively, highlighting the most relevant data points.
- Make informed decisions. Use data-driven insights to direct your social media plans and actions.
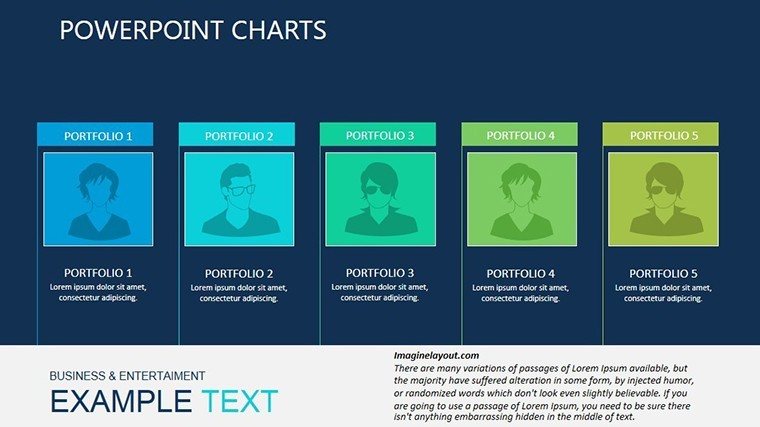
What is included in our template?
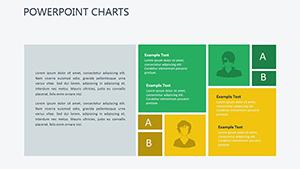
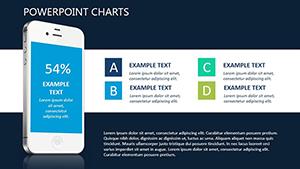
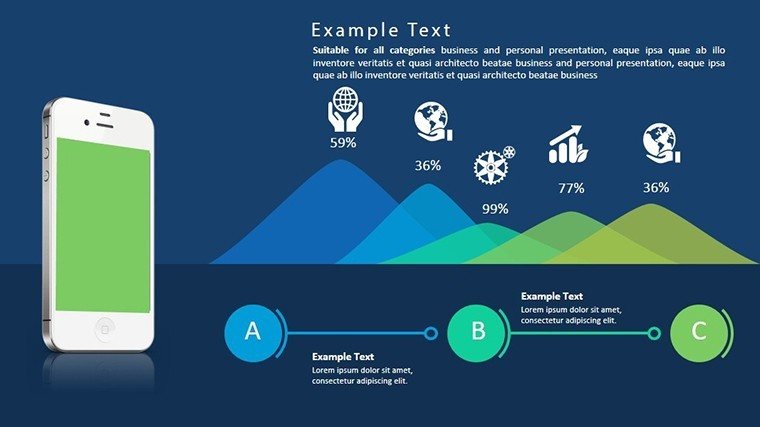
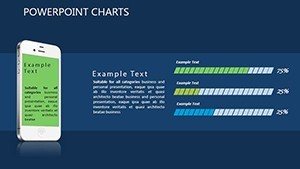
- Visualize likes, comments, and shares across many platforms with engagement charts.
- Track follower growth, reach, and impressions with dynamic charts.
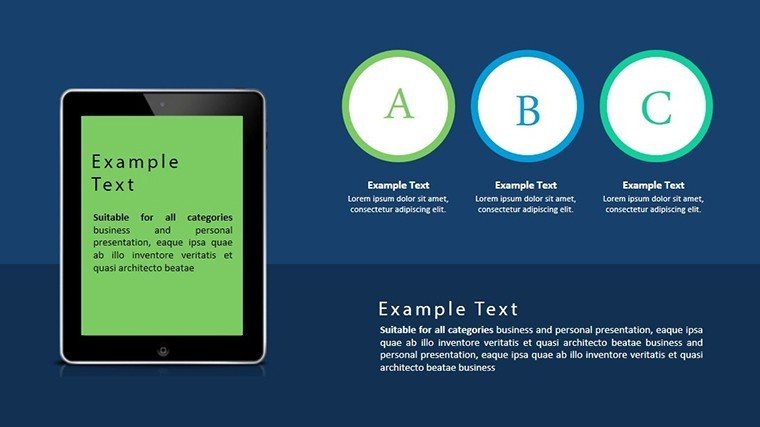
- Analyze the performance of various forms of content to see what connects with your target audience.
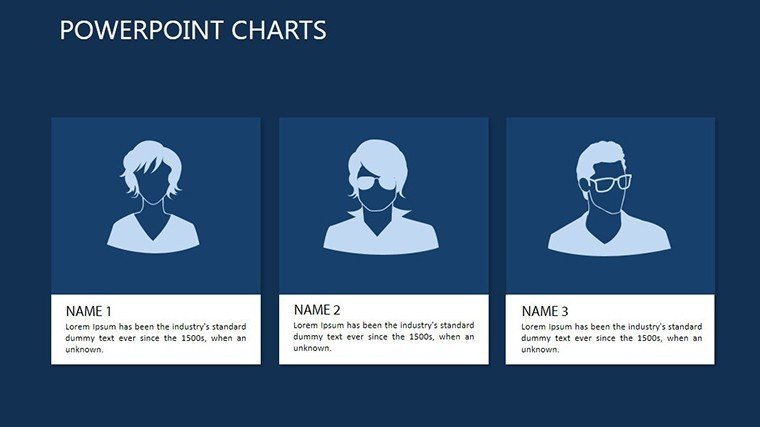
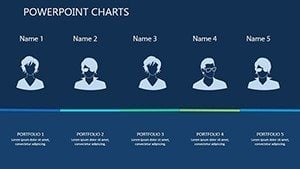
- Demographic Insights: Analyze your audience by age, gender, geography, and more.
Examples of Using Our Template:
- Monthly Reports: Create a thorough, easy-to-understand report of your social media performance each month.
- Strategy presentations: Present your social media plan to clients or team members clearly and confidently.
- Trend Analysis: Use previous data to forecast future trends and modify your approach accordingly.
Are you ready to elevate your social media presentations to the next level? Try our Social Networks PowerPoint Charts today to improve how you visualize and present data. Improve your presentations, captivate your audience, and get greater outcomes with our skillfully created templates.
By implementing these adaptable and user-friendly charts into your workflow, you will save time and guarantee that your social media data is displayed in the most efficient manner possible. Don't pass up the opportunity to improve your presentations—get started now!