Elevate Standards: Quality Category 3D PowerPoint Charts Template


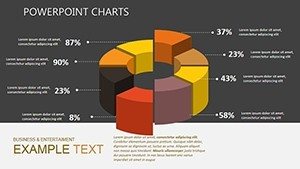


In the relentless pursuit of excellence, presenting quality metrics isn't just informative - it's inspirational. The Quality Category PowerPoint Charts Template, with its 20 editable 3D-infused slides, empowers businesses to articulate product superiority and operational prowess vividly. Geared toward managers and quality assurance teams, it employs spheres and dimensional graphs to symbolize wholeness and depth, making abstract standards tangible. Envision spheres representing compliance layers or 3D bars charting defect reductions - tools that underscore your commitment to perfection.
This template's 3D flair adds a layer of sophistication, compatible with PowerPoint for hassle-free deployment. It addresses the economic ripple of quality, from boosted revenues to enhanced reputations, as evidenced by firms seeing 20% loyalty lifts post-presentation.
Defining Features for Dimensional Impact
Unpack the innovations that make these slides a quality assurance ally.
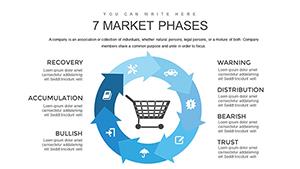
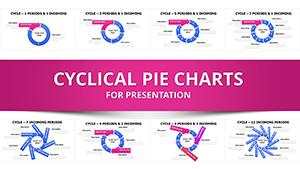
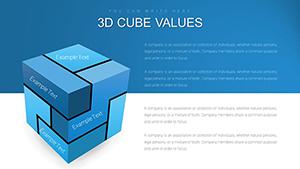
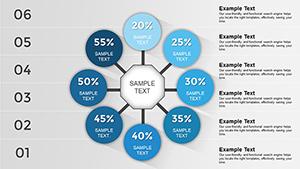
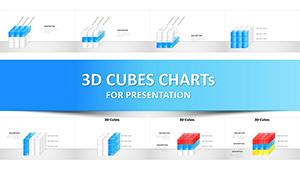
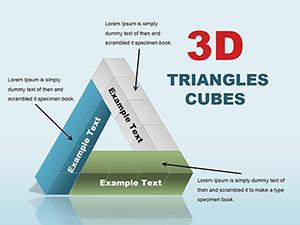
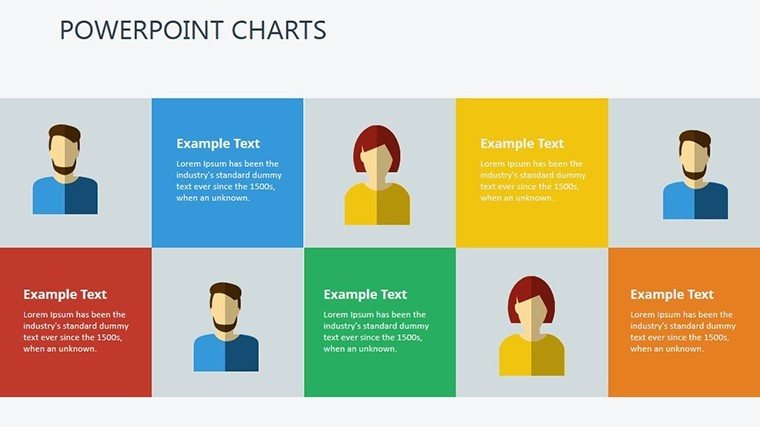
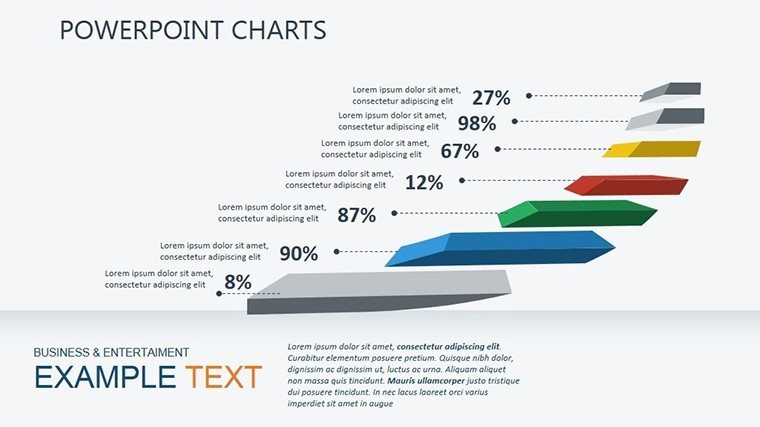
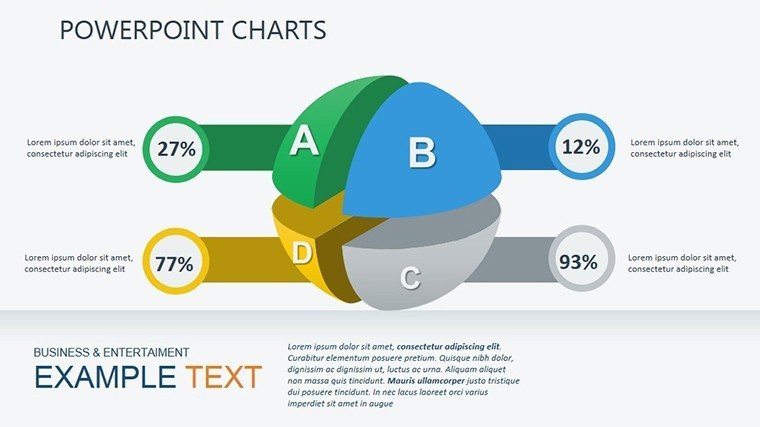
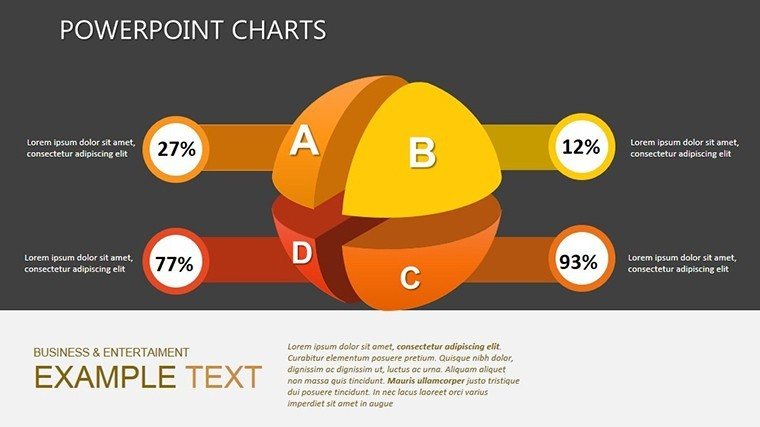
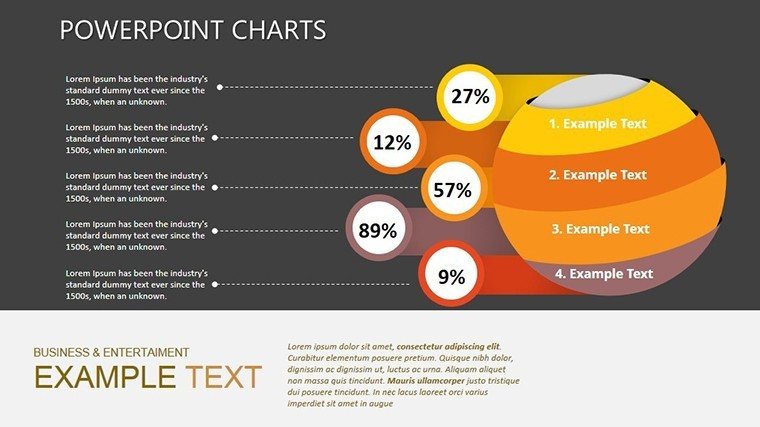
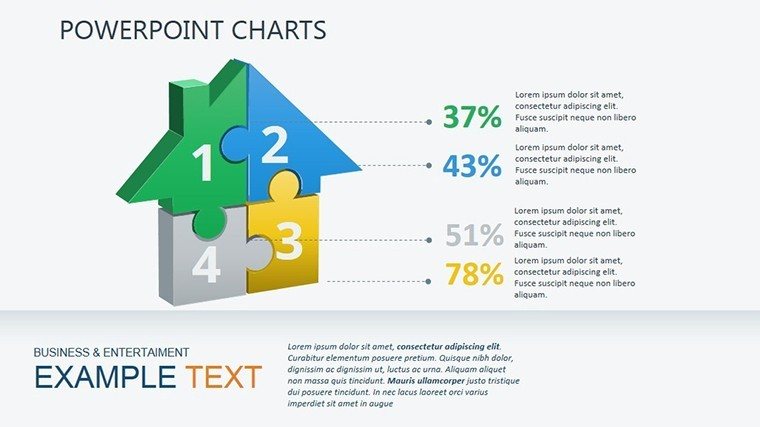
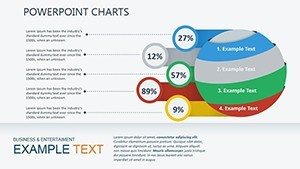
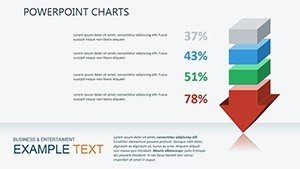
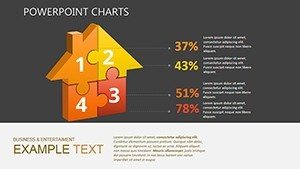
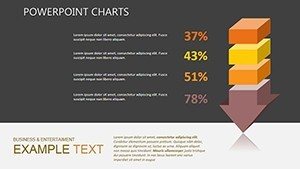
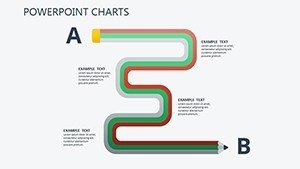
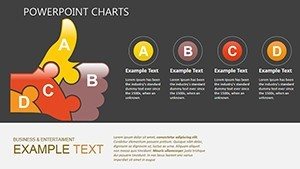
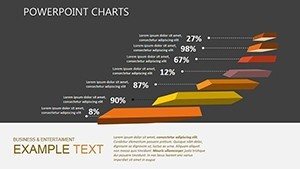
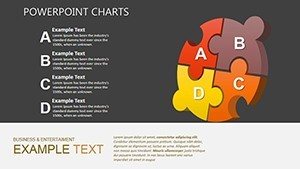
- 3D and Sphere Mastery: Dynamic spheres encapsulate metrics like satisfaction scores, while 3D charts add volume to variance analyses.
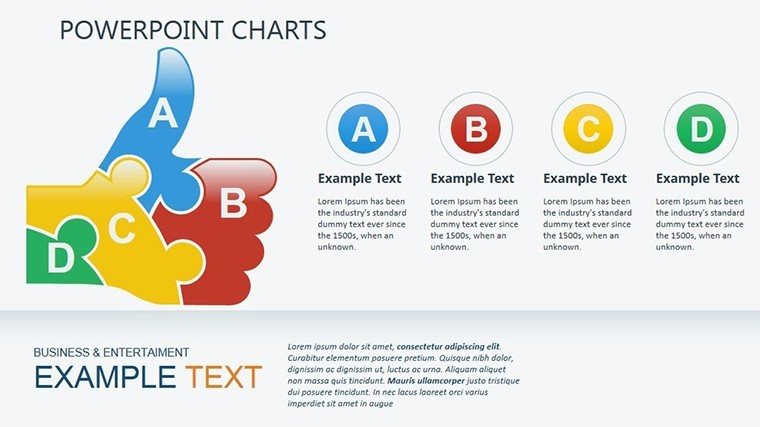
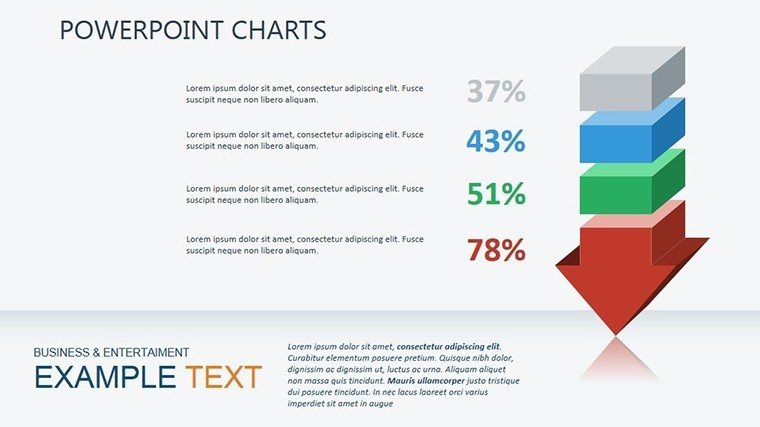
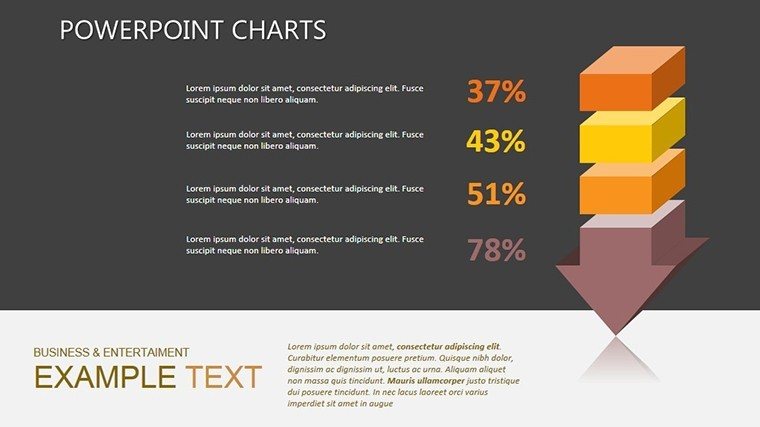
- Adaptive Editing: Morph shapes, calibrate colors for brand harmony, and embed data dynamically for live updates.
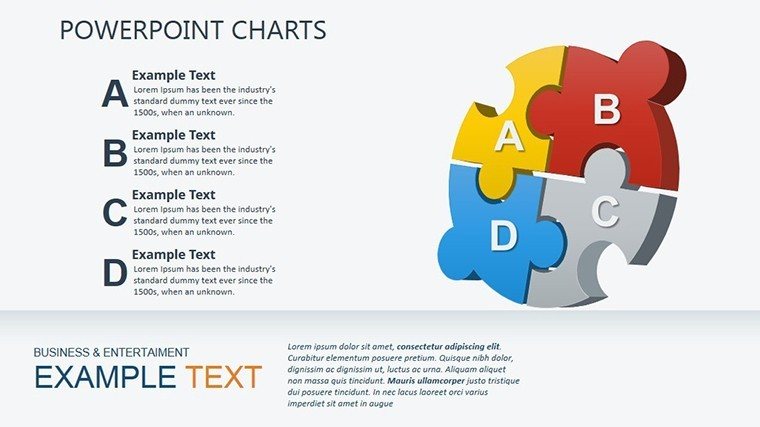
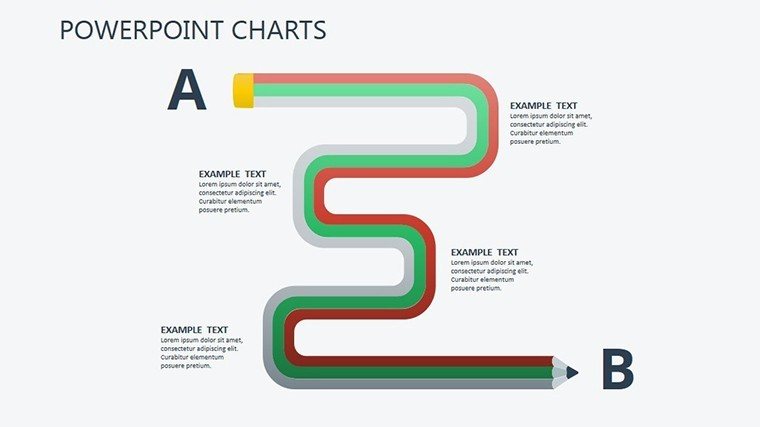
- Streamlined Structure: Logical progression from overviews to deep dives, ideal for audit trails or board updates.
Crafted with input from ISO-certified pros, these features ensure presentations that not only meet but exceed scrutiny.
Precision in Practice: Quality-Driven Applications
Deploy this template where integrity intersects with insight.
Manufacturing Milestones
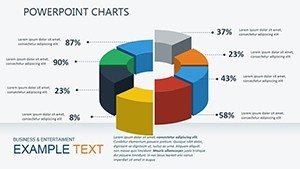
In a factory floor review, 3D spheres illustrate yield rates across lines, revealing efficiencies that propel lean initiatives forward.
Service Sector Spotlights
- Compliance Demos: Layered spheres for regulatory adherence, simplifying audits.
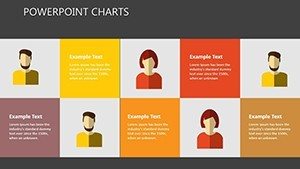
- Customer Feedback: Radial 3D plots for sentiment mapping, guiding improvements.
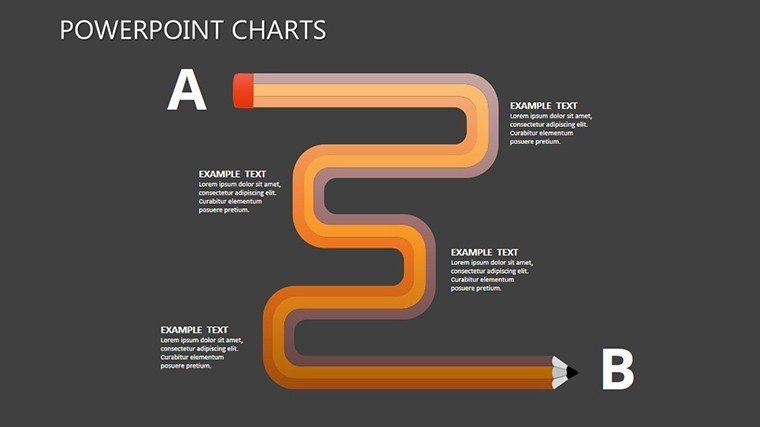
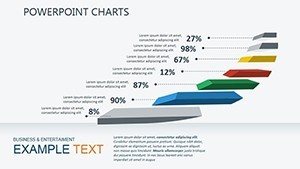
- Progress Tracking: Bar evolutions in depth for KPI journeys.
Such uses fortify trust, turning data into dividends for growth.
Blueprint for Brilliant Builds
Assemble with assurance via this phased plan.
- Launch the Library: Open .pptx in PowerPoint - immediate immersion.
- Infuse Insights: Input quality logs; visuals recalibrate instantly.
- Refine the Render: Tune 3D angles for optimal views, syncing with themes.
- Validate Vision: Simulate sessions to affirm clarity.
- Amplify Reach: Package for reports, extending excellence externally.
Efficient enough for quarterly rushes, profound for annual overhauls.
Quality Hacks for 3D Dominance
Refine your craft with these expert edges:
- Rotate spheres interactively for multi-angle persuasion.
- Cap data series at essentials - clarity trumps completeness.
- Blend textures for tactile feel in visuals.
- Pair with metrics dashboards for holistic views.
With a dash of levity: Label a low-quality outlier as "The Anomaly" - spotlight without spotlighting blame.
Superior to Flat: The 3D Difference
Legacy charts lack depth; this template's dimensionality conveys complexity compellingly, mirroring premium products. Endorsed by quality gurus, it cements your narrative as unassailable.
Quality isn't accidental - it's visualized. Download now and dimension your declarations.
Frequently Asked Questions
What slide count for quality charts?
20 editable slides focused on 3D and spheres.
Suitable for economic presentations?
Yes, ideal for linking quality to wealth and progress.
Editing complexity?
Low - intuitive for quick, professional tweaks.
3D compatibility?
Native PowerPoint 3D rendering, scalable across devices.
Best for product demos?
Spheres excel at holistic quality overviews.
Social impact focus?
Adaptable for societal benefits of high standards.