Professional Medication Pharma Charts PowerPoint Template: Visualize Health Data Accurately


Type: PowerPoint Charts template
Category: Medicine - Pharma
Sources Available: .pptx
Product ID: PC00218
Template incl.: 12 editable slides
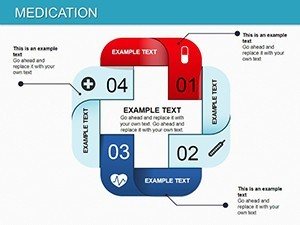
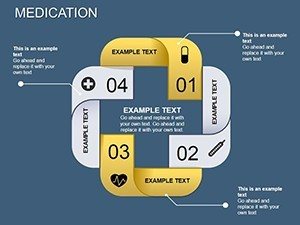
Imagine delivering a medical lecture where complex drug interactions are as clear as day, thanks to charts that precisely map dosages and outcomes. Our Professional Medication Pharma Charts PowerPoint Template achieves this with 12 editable slides tailored for pharmaceutical and healthcare visuals. Ideal for physicians presenting treatment protocols, researchers sharing trial data, or educators teaching pharmacology, it ensures accuracy and engagement.
Anchored in standards from organizations like the FDA for data representation, it builds trust. A hospital pharmacist used it to train staff, improving compliance rates. The clean, clinical design with pharma-themed elements prioritizes readability over flash.
Key Features for Medical Precision
Centered on data-driven charts like pies for breakdowns and lines for trends, it supports evidence-based presentations.
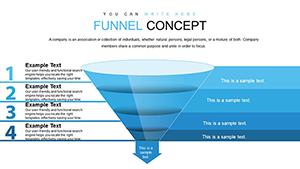
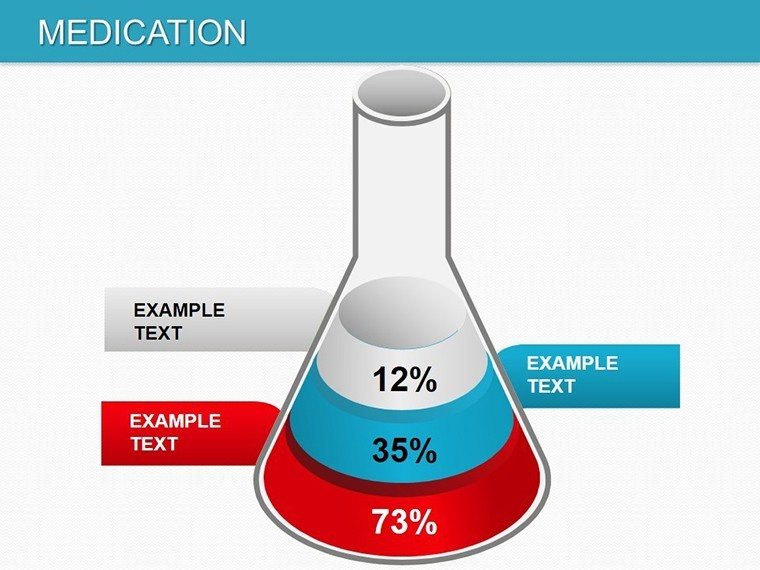
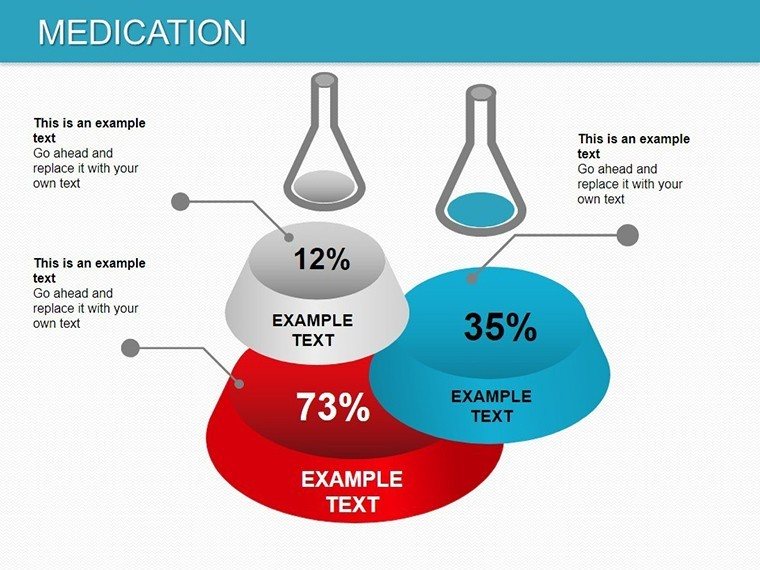
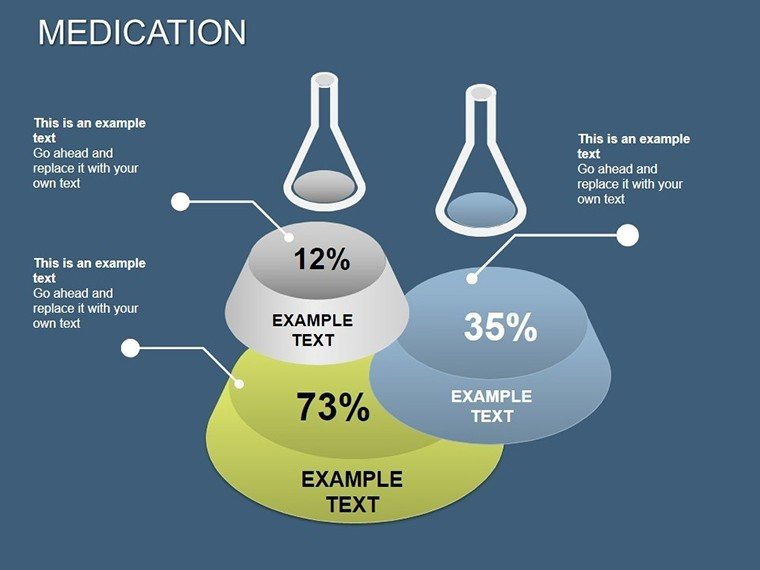
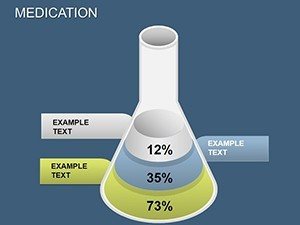
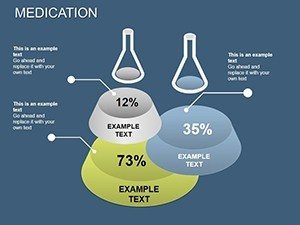
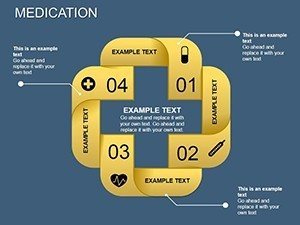
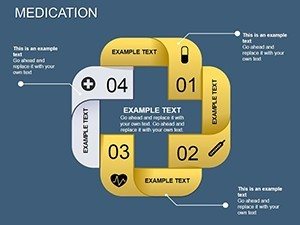
- Dosage Pie Charts: Segment medications by components, with labels for clarity.
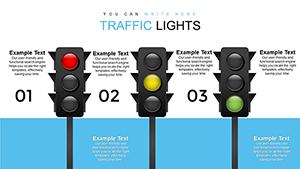
- Progress Line Graphs: Track patient responses over time.
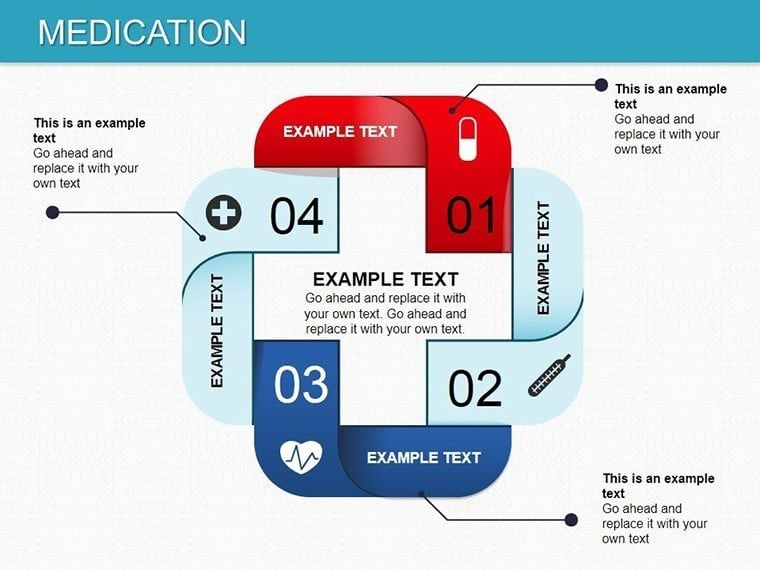
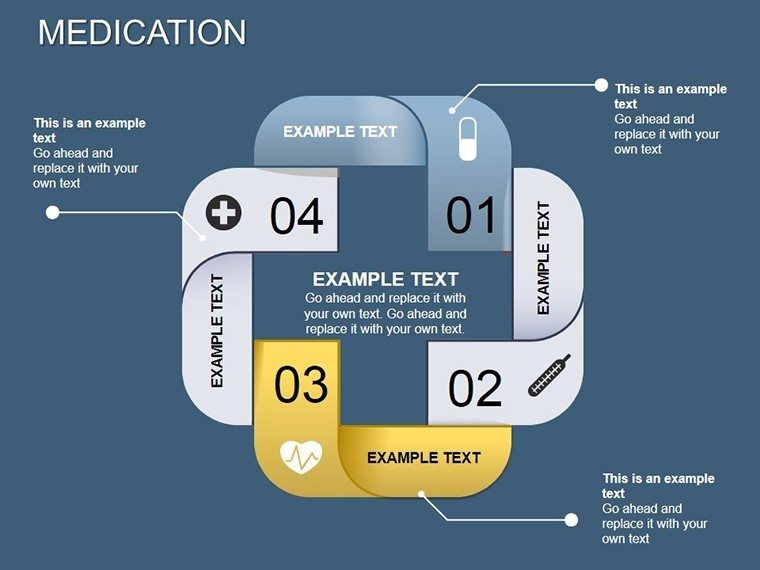
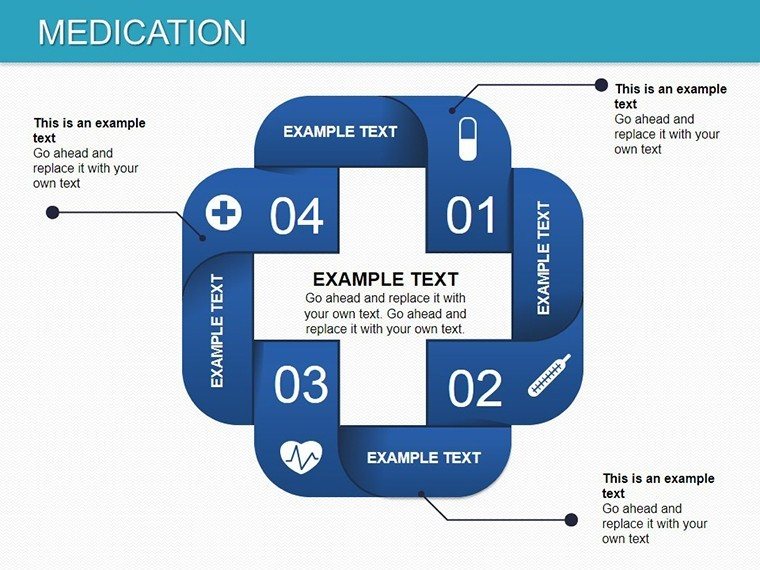
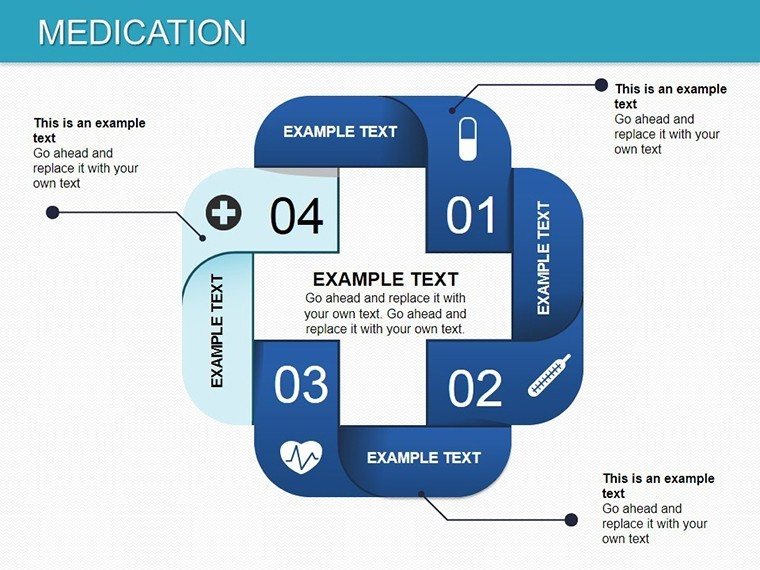
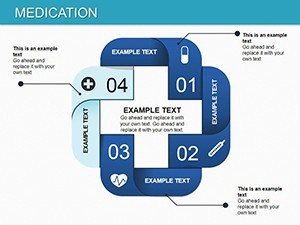
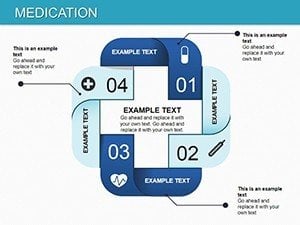
- Layout Variety: Adapt for case studies or overviews.
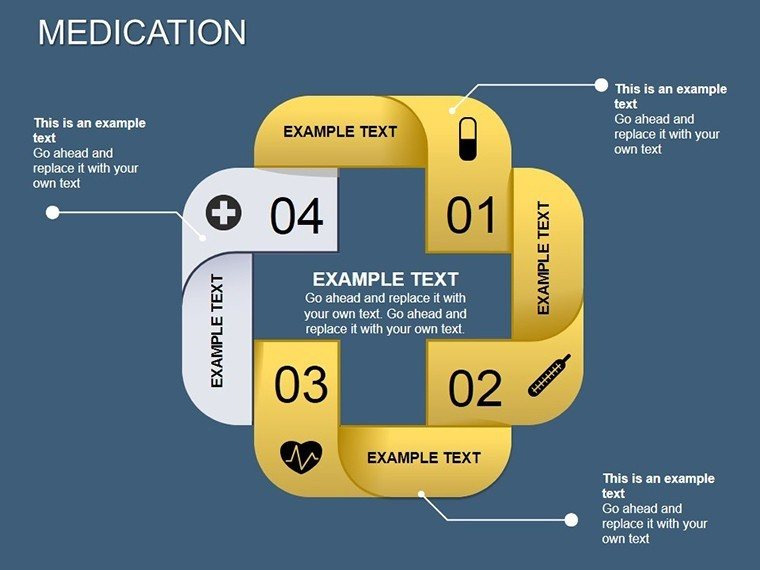
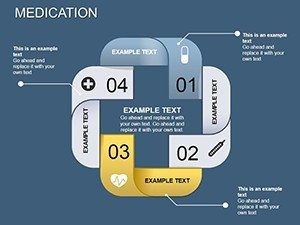
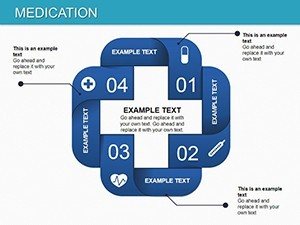
- Color Coding: Use medical palettes for quick recognition.
Surpasses basic charts with HIPAA-friendly anonymity options.
Slide Details for Targeted Use
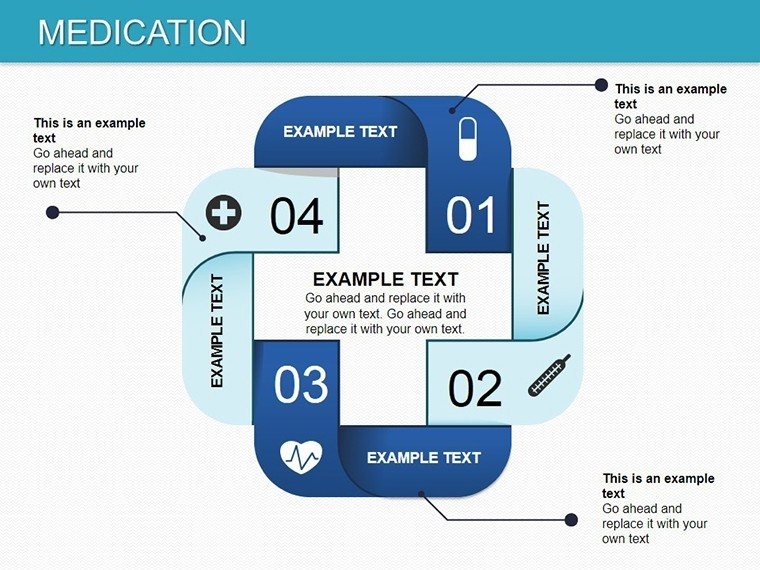
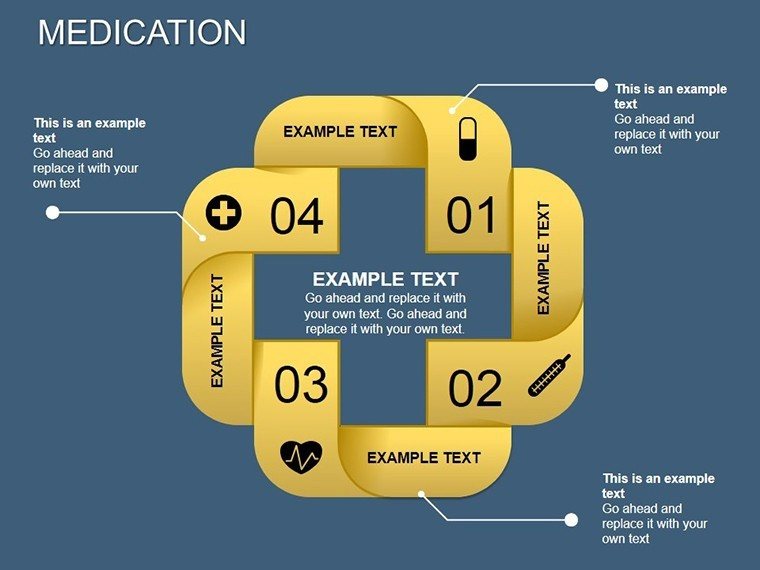
Slide 1 overviews medication categories. Slides 2-5 focus on pie distributions for formulations.
Line trends in Slides 6-9 suit efficacy studies. Comprehensive layouts in Slides 10-12 for summaries.
Applications in Healthcare Settings
For research, graph trial phases. A study's use led to clearer publications. In clinics, illustrate regimens.
Steps: 1) Input verified data; 2) Customize visuals; 3) Add annotations; 4) Review for accuracy.
This upholds medical integrity.
Ensuring Authoritative Presentations
Compatible with secure platforms, accessible designs. Boosts comprehension in critical fields.
Aligns with "Visual Explanations" by Tufte for effective communication.
Medicate your presentations with precision - download and heal through visuals.
Frequently Asked Questions
Are charts compliant with medical standards?
Designed with FDA-inspired accuracy in mind.
Can I anonymize data?
Yes, built-in tools for privacy.
How do I handle complex datasets?
Layered charts manage multifaceted info.
Is customization quick for busy pros?
Intuitive interface saves time.
Supports collaborative editing?
Yes, via Google Slides integration.