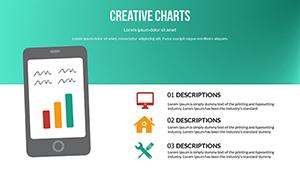
Turn numbers into narratives with our money chart PowerPoint templates, engineered for finance leaders who demand clarity and persuasion. These slides pack animated charts, from pie allocations to line projections, helping you dissect budgets, showcase ROI, and forecast trends with professional finesse.
Compatible with Microsoft PowerPoint, templates feature smart art integration for effortless updates - change data, and visuals refresh instantly. Customize axes, legends, and colors to align with corporate palettes, while transitions highlight key insights smoothly.
For boardrooms or investor updates, these tools amplify your message, making complex fiscal data accessible and engaging. Whether tracking quarterly earnings or planning expansions, find the chart style that suits - download and elevate your presentations today.


Money chart templates transform routine reports into strategic assets. CFOs deploy waterfall charts to break down profit variances, pinpointing cost drivers visually. Sales teams use funnel diagrams to map revenue pipelines, converting abstract figures into actionable paths.
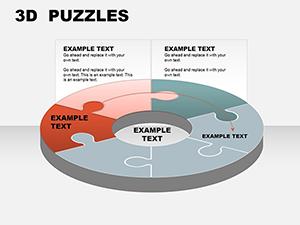
Consultants illustrate market shares with donut charts, customizing segments for client-specific scenarios. Non-profit directors track donation impacts via stacked bars, demonstrating fund efficiency transparently.
PowerPoint`s built-in charts are functional but bland, lacking thematic cohesion for finance themes. Our templates infuse money motifs - gold gradients, ledger lines - while pre-building multi-series for deeper analysis, unlike one-off inserts.
They include data validation to prevent errors, a safeguard missing in basics, and export to animated GIFs for reports. Responsive scaling ensures clarity on slides or handouts.
Link to Excel for live data feeds, apply 3D effects judiciously, or embed formulas for scenario modeling directly in slides.
Select chart types matching data nature - lines for trends, areas for cumulatives. Limit to 5-7 data points per visual to avoid clutter. Annotate peaks with callouts, explaining variances contextually.
Incorporate accessibility with alt text and color-blind palettes. Rehearse narrations tying charts to stories, not just stats. Update sources pre-presentation for currency.
A venture capital firm`s bubble chart template visualized startup valuations, securing $2M in funding through intuitive scaling. An analyst`s heat map on expense trends uncovered 15% savings opportunities for a retailer.
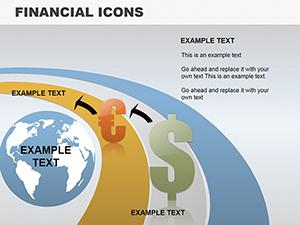
These cases reveal power: from macroeconomic overviews with world maps to micro-level transaction flows. Templates fuel discoveries that propel growth.
Harness data`s potential fully. Grab a money chart PowerPoint template and present with authority.
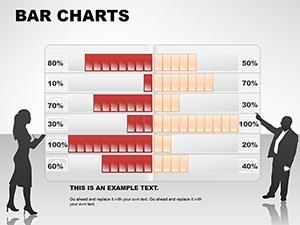
Comprehensive set including bars, lines, pies, and specialized finance visuals like candlesticks.
Yes, via linked Excel tables or Power Query for real-time refreshes.
Subtle builds and wipes to reveal data progressively without distraction.
Typically 15-30, focused on chart variations with supporting text slides.
Exportable to PPTX for easy import and adaptation.
Fully - import CSVs or manual entry with flexible row/column adjustments.
Let charts illuminate your financial vision. Download now and lead with insight.
Copyright © 2009-2026 ImagineLayout All rights reserved.