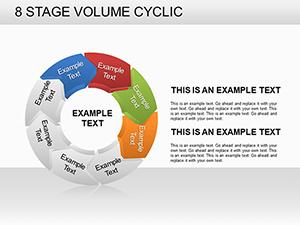
Bring Data to Life with 3D Volumetric Box Charts
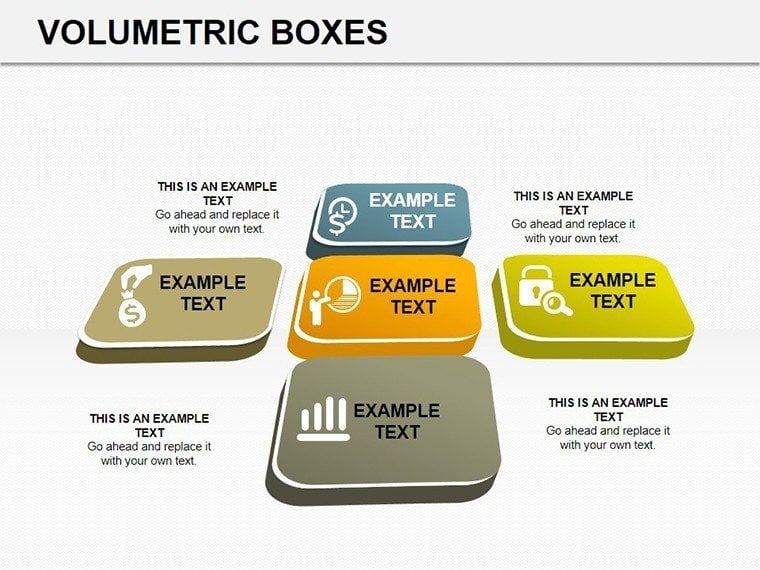

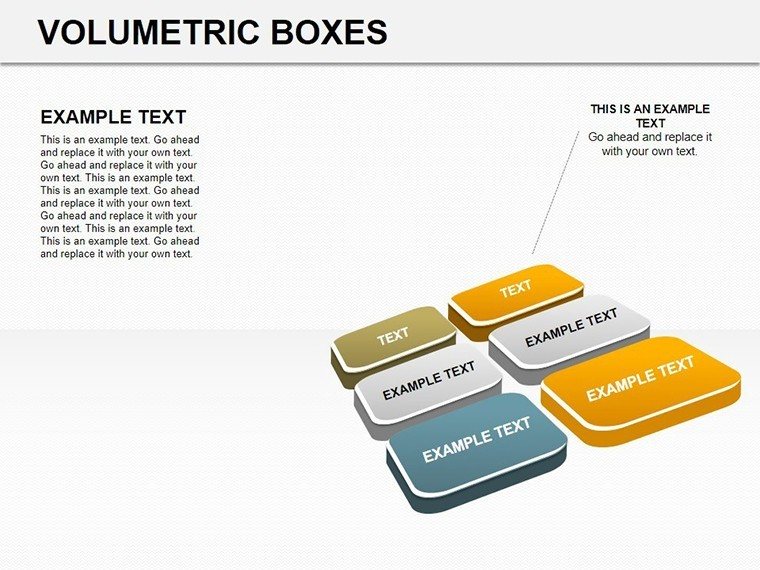


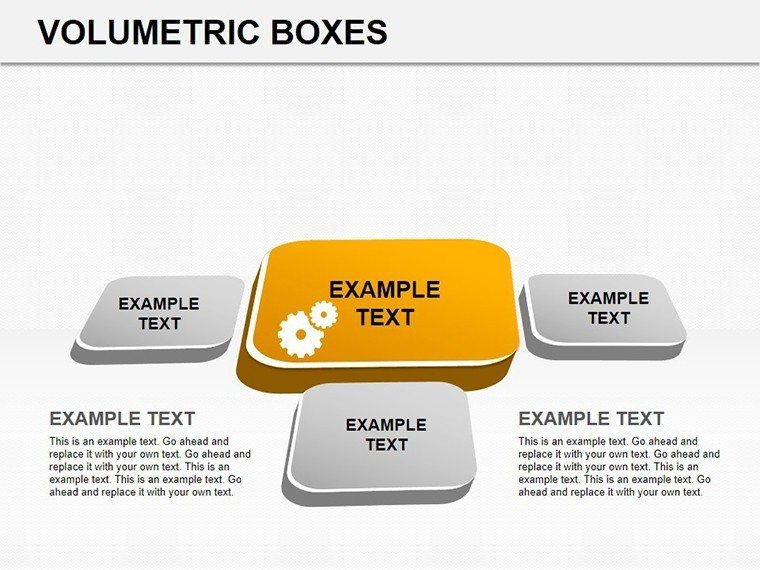


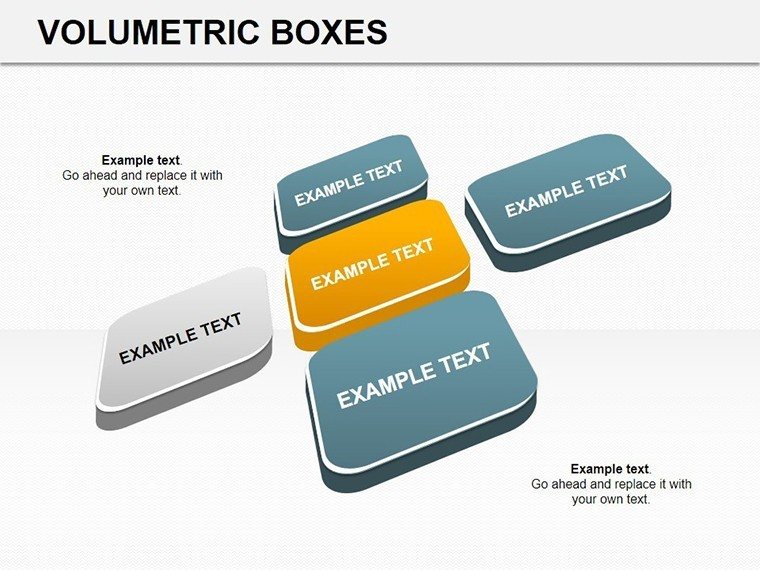


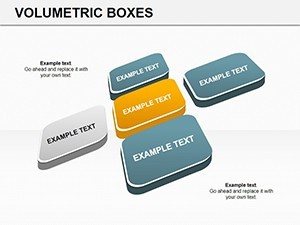
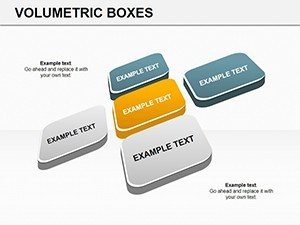
When flat charts fall short, our Volumetric Boxes PowerPoint Charts Template steps in, delivering 17 editable slides that add depth - literally - to your presentations. These 3D visuals excel at representing volumes, such as building masses in architecture or sales volumes in business, making abstract data tangible and memorable. Crafted for analysts, designers, and leaders, this template harnesses perspective to draw eyes and drive insights, turning routine reports into riveting reveals.
For architects, it's a game-changer: Visualize spatial distributions in compliance with zoning regs or AIA volumetric standards. Benefits include heightened engagement through shadows and rotations, plus easy edits that save design time, allowing focus on your core message.
Essential Features for Dimensional Mastery
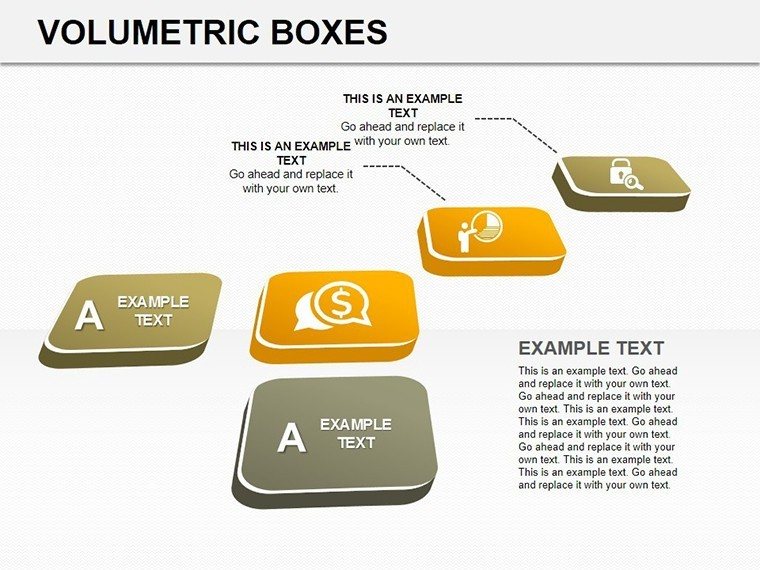
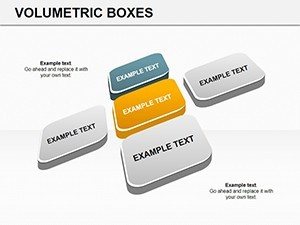
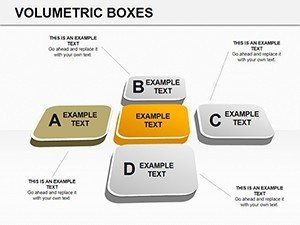
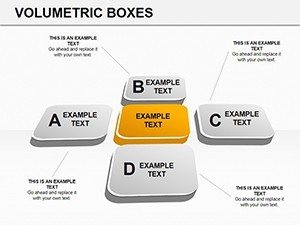
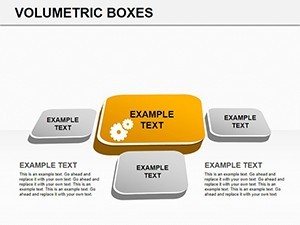
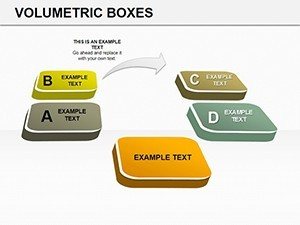
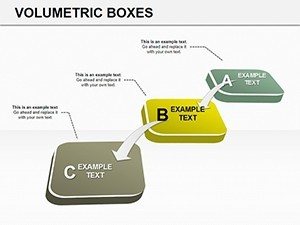
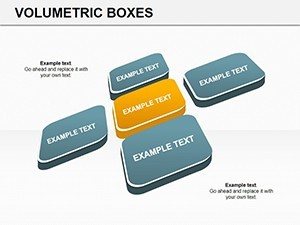
The 17 slides feature varied 3D box configurations, from stacked volumes to scattered plots, all editable for precision.
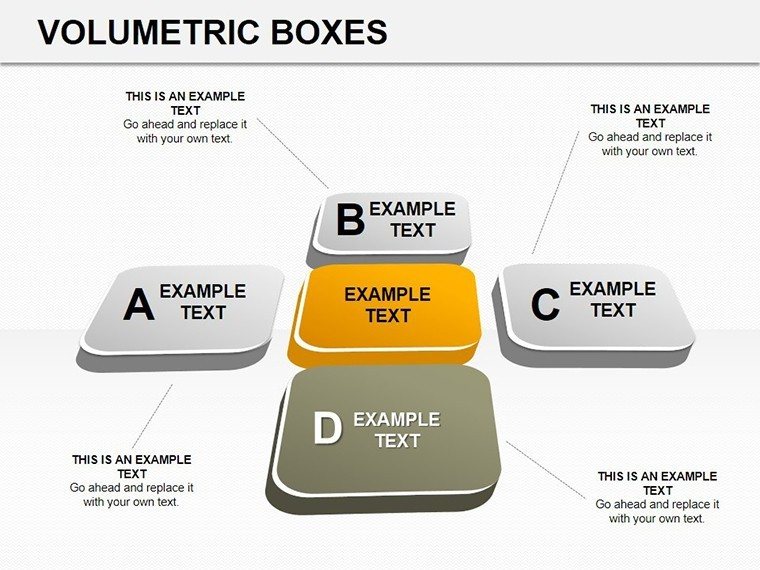
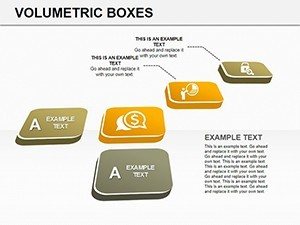
- Depth Customization: Adjust box heights and perspectives for realistic rendering.
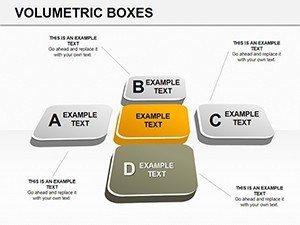
- Color Gradients: Use shading to denote values, like density in urban plans.
- Data Linking: Connect to Excel for live updates in dynamic presentations.
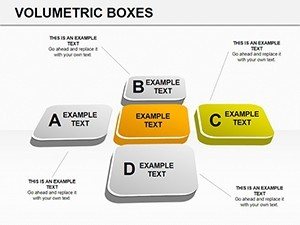
- Style Variants: Multiple themes, including metallic for modern architecture vibes.
Built on vector tech, they scale flawlessly, integrating with PowerPoint's 3D tools for rotations during talks.
Practical Scenarios That Shine
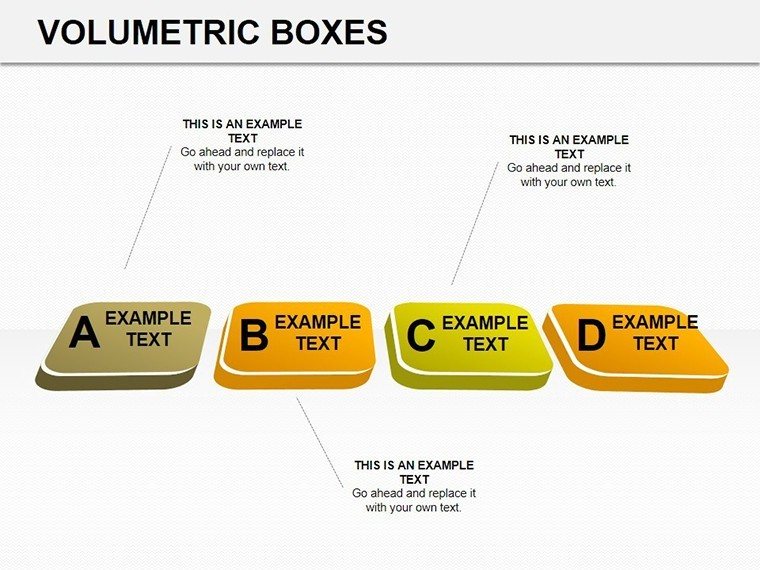
In an architectural context, use these for site volume analyses: Stack boxes to show building envelopes against skyline limits, as in a case from a Chicago firm where such visuals clinched a high-rise bid. Market researchers can depict consumer segments in 3D, revealing overlaps vividly.
Project managers track timelines volumetrically, with box sizes representing task durations. Educators illustrate physics concepts like volume displacement. Each use tackles flat-data boredom, providing a 3D edge that boosts retention by up to 30%, per design studies.
Implementation Steps for Seamless Use
- Acquire the Template: Download .pptx for immediate access.
- Populate with Data: Input metrics; watch boxes auto-adjust.
- Refine Aesthetics: Tweak angles for optimal view, add labels.
- Deliver Dynamically: Animate entries for dramatic effect.
Outperforms native PowerPoint by offering pre-built 3D frameworks, minimizing setup frustrations.
Architectural Depth in Every Dimension
Architects, envision rendering a pavilion's volumetric form alongside cost breakdowns - pure synergy. Channel Frank Gehry's bold shapes with twisted boxes for avant-garde pitches. And hey, if your data's as flat as a pancake, these charts add the fluff it needs without the calories.
Tips: Balance complexity with simplicity; use lighting effects sparingly. From expert lenses, these enhance authoritativeness in proposals.
Expert Advice on 3D Visualization
Optimize by aligning views with audience perspectives; test on multiple devices. Incorporate accessibility with descriptive narrations. These strategies build trust, showcasing your command over data dimensions.
Elevate to 3D now - secure your volumetric toolkit and depth-charge your next presentation.
Frequently Asked Questions
How do I edit the 3D aspects?
Drag to resize or rotate; fully customizable in PowerPoint.
Suitable for architecture volume models?
Yes, ideal for spatial and massing studies.
Compatible with older PowerPoint?
Works best with 2016+ for full 3D features.
Can I link to external data?
Absolutely, via Excel integration.
What makes it unique?
Pre-designed volumetric styles not found in basics.
Animation support?
Yes, for rotating and zooming effects.