Infographic Annular PowerPoint Charts Template - Download PPTX


Type: PowerPoint Charts template
Category: Pie
Sources Available: .pptx
Product ID: PC00233
Template incl.: 22 editable slides
This Infographic Annular PowerPoint Charts template is a useful tool for making visually stunning and informative presentations. The clean, modern style works well for a range of themes, and the easy-to-edit charts and visuals make it straightforward to tailor the template to your unique requirements. Annular Infographic PowerPoint Charts Template is the solution you've been looking for. This dynamic, visually beautiful template will transform your presentations by making them more interesting, educational, and memorable.
Features of Annular Infographic PowerPoint Charts Template
Our template is designed to provide you with all the tools you need to create amazing presentations. Here are some of the key features:
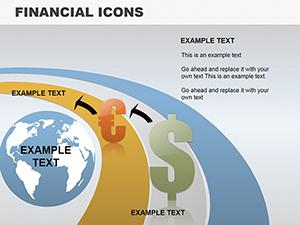
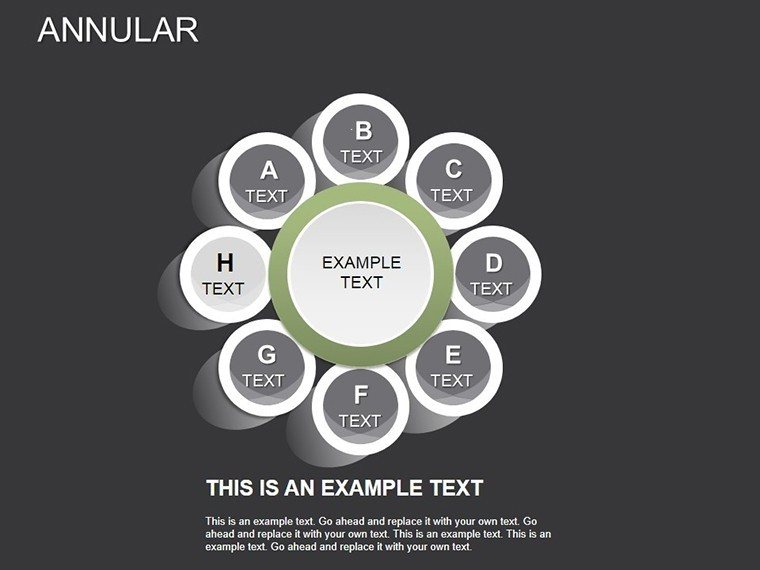
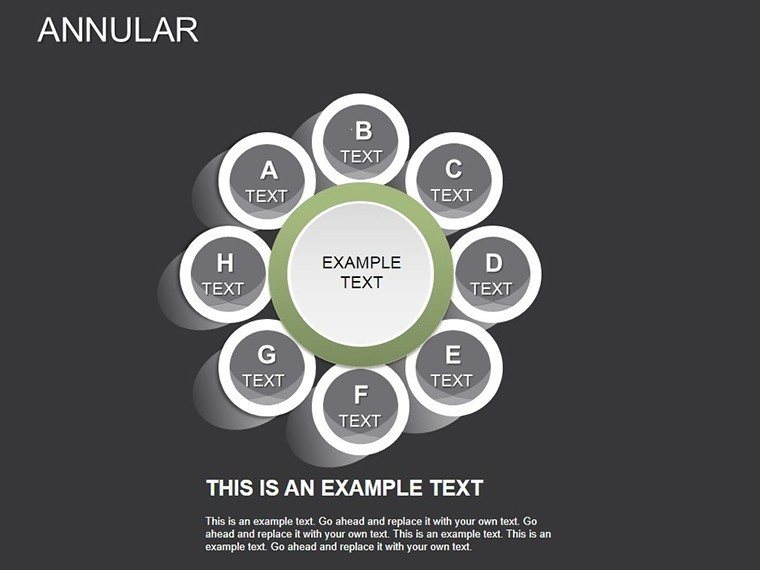
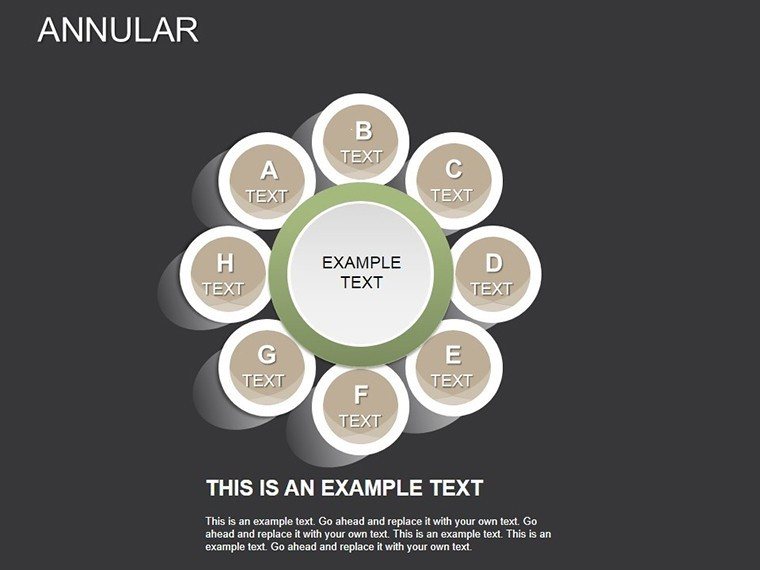
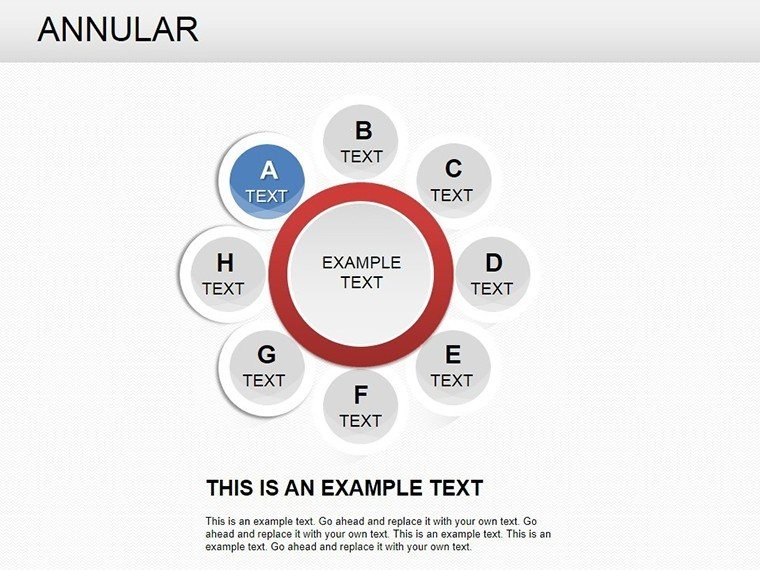
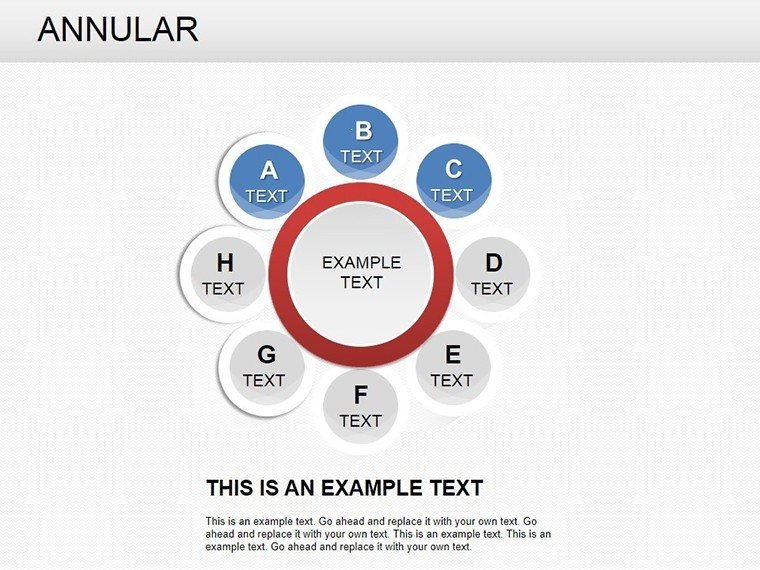
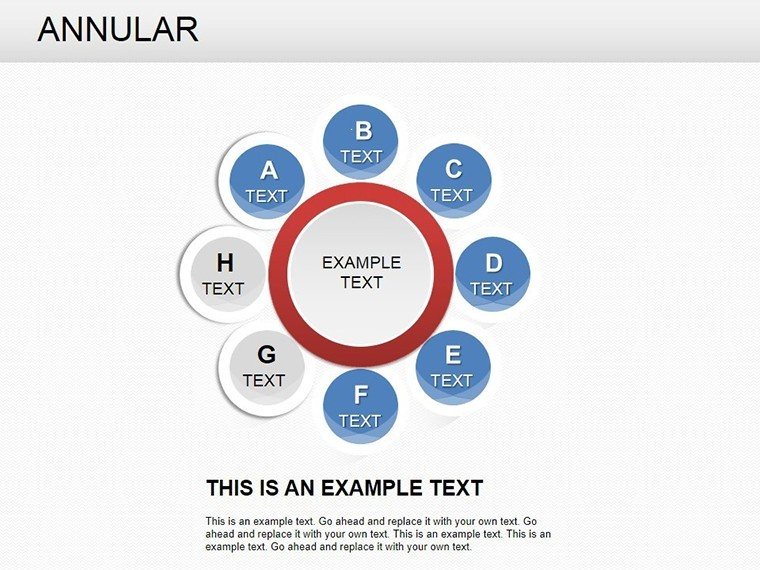
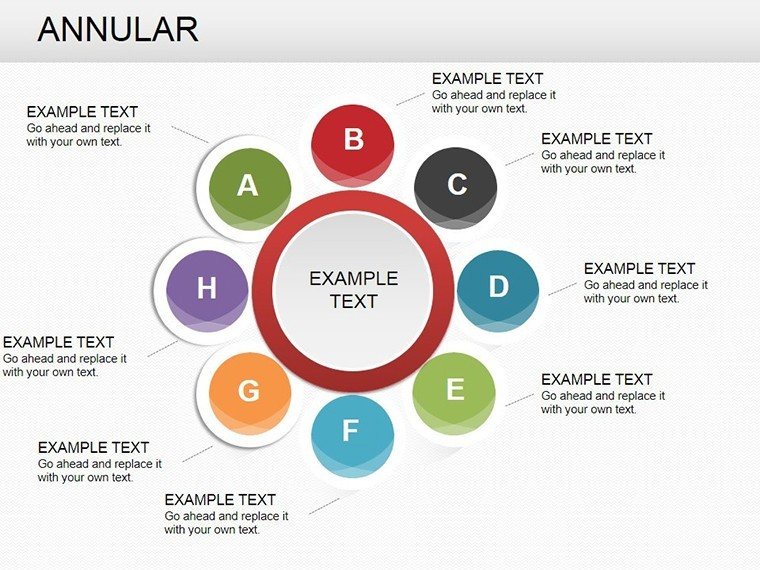
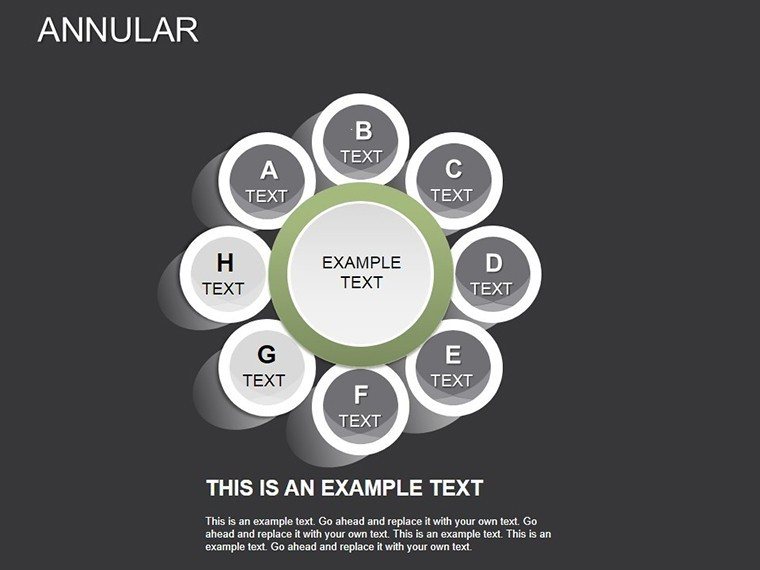
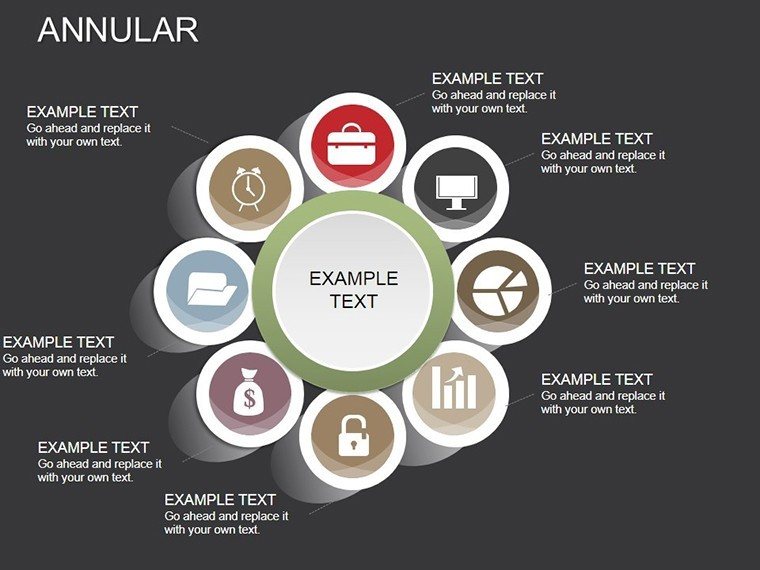
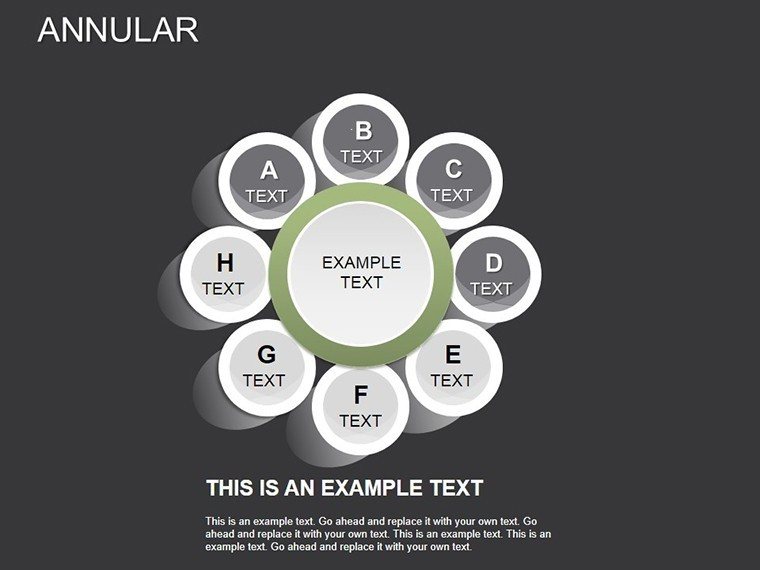
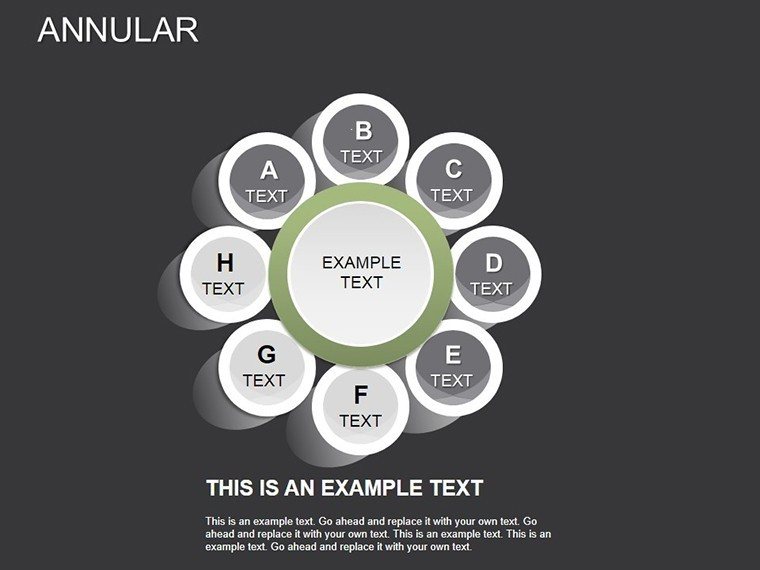
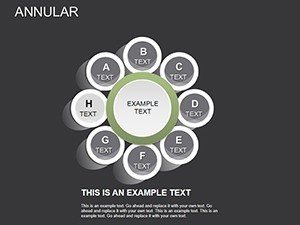
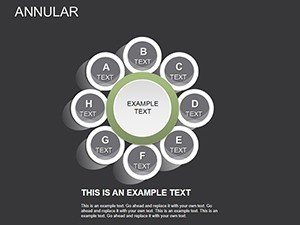
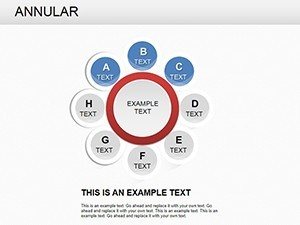
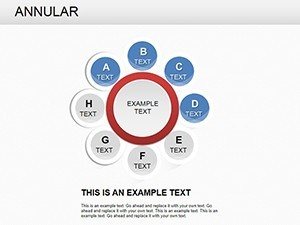
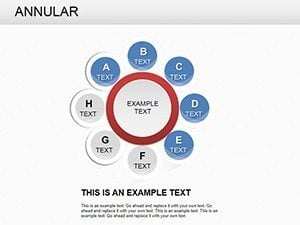
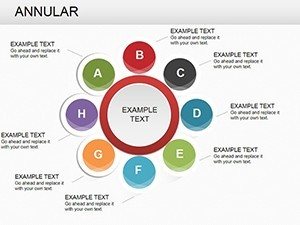
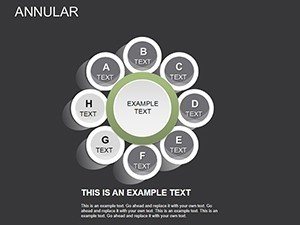
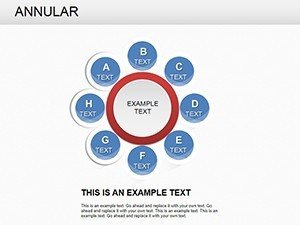
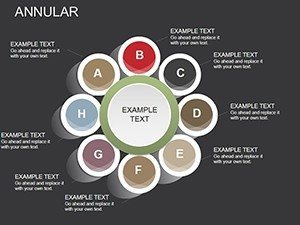
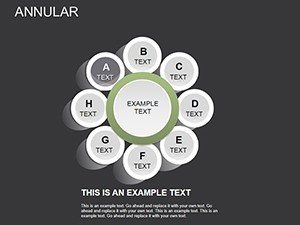
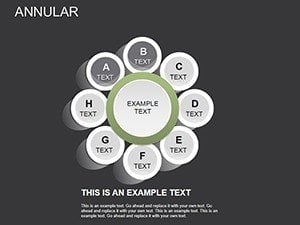
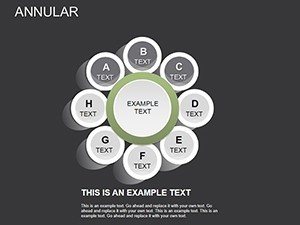
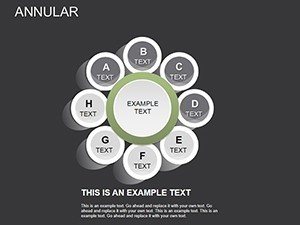
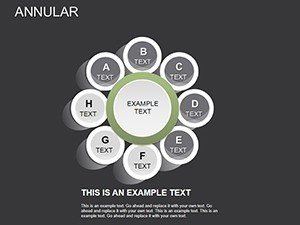
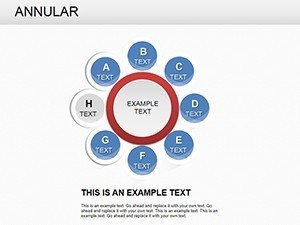
- Unique Annular Design: The annular (ring-shaped) charts have a new and modern appearance that distinguishes them from typical bar and line charts.
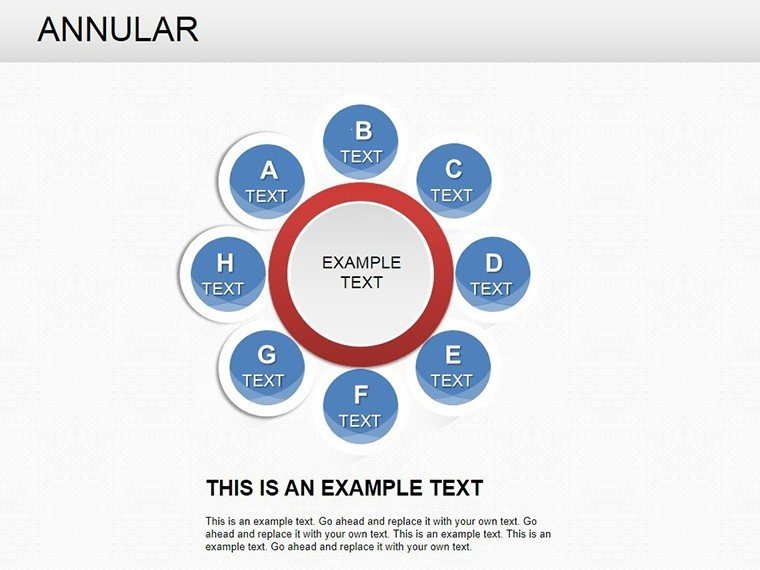
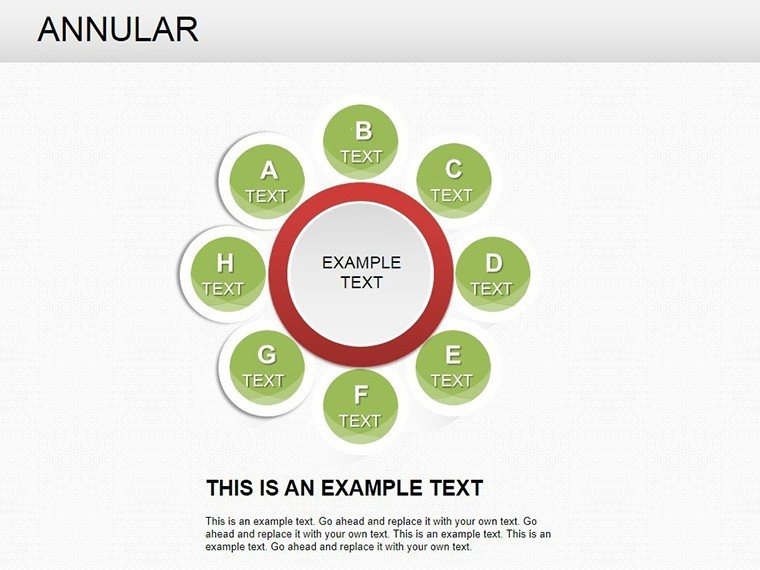
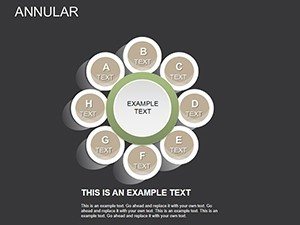
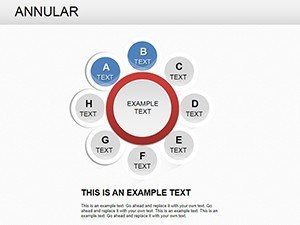
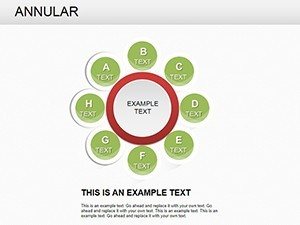
- Easily customizable: Customize colors, sizes, and data points to meet your exact requirements.
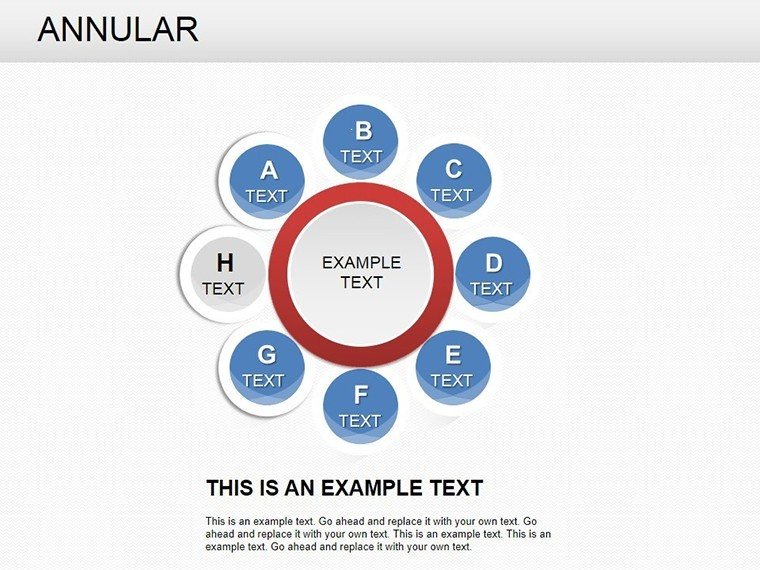
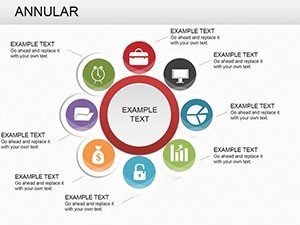
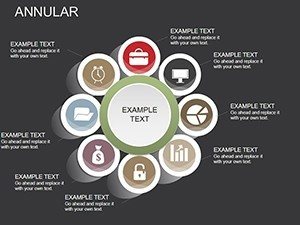
- High-quality graphics: High-quality graphics that look fantastic on any screen size, including laptops and huge projectors.
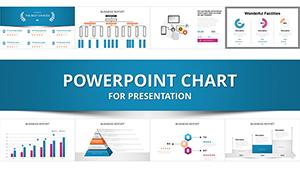
- Various charts: Includes pie charts, donut charts, and progress rings to accommodate many sorts of data.
- User-Friendly: Easy to use, especially for people with little PowerPoint expertise.
Benefits of Using Our Template
Using our Annular Infographic PowerPoint Charts Template has various benefits that will make your presentations more successful and professional:
- Engage your audience: The distinctive design attracts and retains your audience's interest.
- Simplify Complex Data: Convert complex data sets into clear images.
- Save Time: Use pre-designed charts to rapidly build impressive presentations without beginning from scratch.
- Increase Impact: Using high-quality images enhances the impact and memory of your main messages.
- Boost Credibility: A polished, professional presentation builds your credibility and expertise on the subject.
Who Can Benefit from this Template?
Our template is ideal for a variety of professionals that need to convey data properly:
- Business professionals: Ideal for delivering reports, business proposals, and strategic planning presentations.
- Educators: Make lectures and instructional materials more entertaining by using visual aids.
- Marketers: Present marketing outcomes, market analysis, and strategy plans.
- Researchers: Present your conclusions and facts in a clear, persuasive manner.
- Students: Stand out in academic presentations and projects.
What the Template Contains
The Annular Infographic PowerPoint Charts Template has a number of ready-to-use slides that cater to various presentation needs:
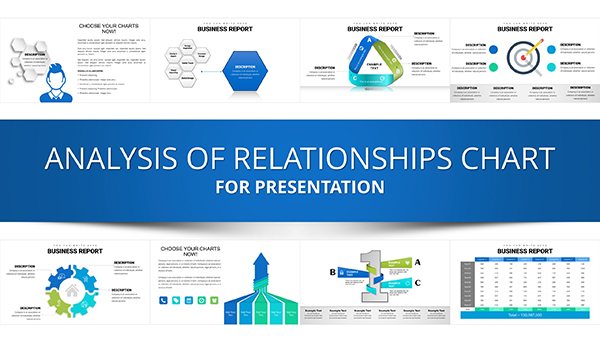
- Introductory slides: Set the tone with professional-looking introduction slides.
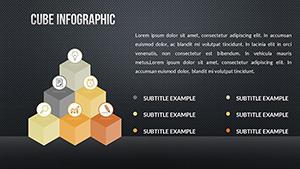
- Data Visualization Slides: A collection of annular charts for presenting data clearly and beautifully.
- Text and Image Slides: Integrate text and graphics for more effective communication.
- Conclusion Slides: Summarize your main ideas and make a lasting impact.
Examples for Using the Template
Here are some examples of how to utilize our template effectively:
- Quarterly business reviews: Use circular charts to display sales numbers, growth indicators, and financial information.
- Marketing Reports: Display campaign results, conversion rates, and ROI with attractive graphics.
- Educational lectures: Make statistics and research data more accessible and entertaining for students.
- Impress stakeholders: Present clear and engaging data presentations that illustrate the project's worth.
Why Do You Need This Template?
In today's fast-paced world, attracting and holding your audience's attention is more difficult than ever. Our Annular Infographic PowerPoint Charts Template is a great tool for improving your presentations, making them not only more visually appealing but also more successful at communicating your point. Whether you are a business professional, instructor, marketer, researcher, or student, this template can help you improve your presentations and achieve your objectives.
Do not settle for average presentations. Boost your presentations with this Annular Infographic PowerPoint Charts Template. Click here to download and begin generating amazing, powerful presentations now!