Model Keynote Charts

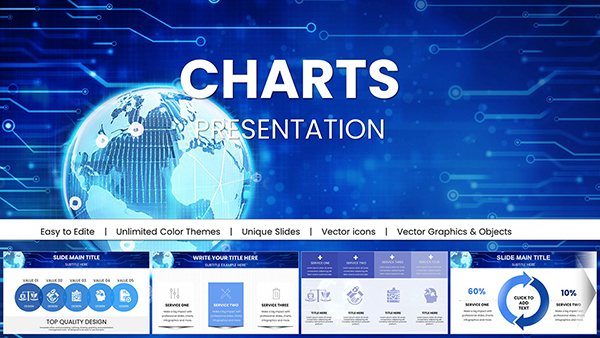
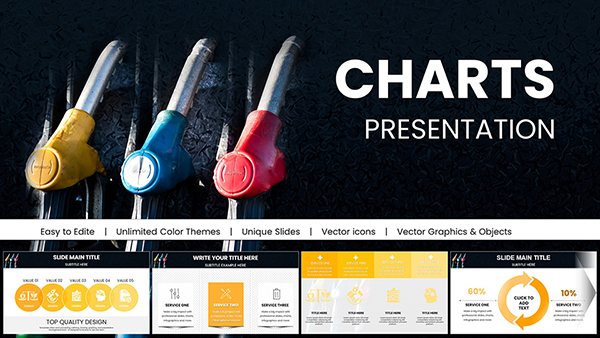
Model charts in Keynote bring abstract strategies to life, offering structured visuals that map out plans and projections. Our collection targets executives, consultants, and innovators seeking to articulate complex models - from business canvases to predictive analytics - in an Apple-native format.

These templates excel in fostering understanding, using clean lines and scalable elements to represent variables, flows, and outcomes. Whether dissecting a value proposition or forecasting market trends, each chart type simplifies the sophisticated, making your Keynote deck a powerful tool for decision-making.

With Keynote`s fluid animations, these models transition smoothly, revealing layers progressively to build your case. Customize effortlessly to reflect your data`s nuances, ensuring authenticity in every slide. Browse this category to discover templates that turn theoretical models into tangible triumphs.


View by: Last Added | Most Popular
  • like 4
    (16)
    Music Charts Keynote Template: Harmonize Your Data Story
    ID: #KC01035
    $18.00
  • like 3
    (818)
    Global Network Charts Keynote Template
    ID: #KC01030
    $18.00
  • like 2
    (165)
    Gas Prices Keynote Charts: Visualize Fuel Trends
    ID: #KC01000
    $18.00
  • like 3
    (200)
    WiFi Internet Connection Keynote Charts Template
    ID: #KC00958
    $18.00
  • like 4
    (89)
    Step Solutions Keynote Charts: Transform Complex Processes into Clear Visual Narratives
    ID: #KC00905
    $20.00
  • like 3
    (1117)
    Personal Protective Equipment PPE Keynote Charts: Illustrate Safety Effectively
    ID: #KC00888
    $18.00
  • like 3
    (107)
    Organizations Work Keynote Charts: Streamline Coordination
    ID: #KC00820
    $15.00
  • like 3
    (1013)
    Organization Tree Keynote Charts: Visualize Hierarchies Effortlessly
    ID: #KC00819
    $16.00
  • like 3
    (1142)
    3D Steps Processing Keynote Charts Template: Visualize Processes with Depth
    ID: #KC00809
    $20.00
  • like 3
    (838)
    Innovation Process Steps Keynote Template: Fuel Your Business Growth
    ID: #KC00798
    $18.00
  • like 4
    (721)
    Oil Report Keynote Charts: Mastering Global Market Insights
    ID: #KC00792
    $17.00
  • like 4
    (943)
    Hierarchy Organizational Structure Keynote Charts Template
    ID: #KC00741
    $18.00
  • like 5
    (399)
    Devices Responsive Illustrations Keynote Charts Template
    ID: #KC00739
    $19.00
  • like 4
    (48)
    Steps to Action: Keynote Charts for Effective Campaign Planning
    ID: #KC00723
    $15.00
  • like 2
    (700)
    Company Introduction Keynote Charts Template
    ID: #KC00717
    $20.00
  • like 2
    (406)
    Steps to Solve Problems Keynote Charts: Master Clear Presentations
    ID: #KC00702
    $23.00
  • like 2
    (474)
    Ribbon Interconnections Keynote Charts - Infographic Mastery
    ID: #KC00693
    $15.00
  • like 3
    (104)
    4 Steps Square Keynote Charts: Streamline Your Business Narratives
    ID: #KC00686
    $12.00
  • like 4
    (647)
    Editable 6-Step Circular Charts Keynote Template
    ID: #KC00672
    $12.00
  • like 3
    (490)
    Lab Glassware Keynote Charts Template for Science
    ID: #KC00671
    $15.00
  • like 4
    (323)
    Important Rhombus Puzzle Keynote Charts: Transform Data into Engaging Puzzles
    ID: #KC00665
    $18.00
  • like 4
    (802)
    Puzzles Compiled Keynote Charts: Assemble Ideas into Captivating Visuals
    ID: #KC00664
    $18.00
  • like 3
    (790)
    Empower Your Choices: Free Decision Making Keynote Charts Template
    ID: #KC00660
    free
  • like 4
    (705)
    Free Organizational Keynote Chart Template: Structure Your Success Visually
    ID: #KC00635
    free


Harnessing Model Charts for Impactful Keynote Decks

Keynote`s elegance pairs perfectly with model charts, enabling nuanced storytelling through visuals that evolve with your narrative. Our templates cover essentials like Porter`s Five Forces or SWOT matrices, but extend to custom hybrids for niche needs. This approach demystifies strategies, helping teams align on visions with shared clarity.

In boardrooms or workshops, these charts facilitate discussions - imagine a canvas model where revenue streams light up as you discuss scalability, captivating stakeholders instantly.

Standout Features of Our Templates

  • Vector Precision: Shapes resize without distortion, ideal for detailed modeling.
  • Magic Move Compatibility: Seamless animations between model states for dynamic reveals.
  • Theme Sync: Harmonize with Keynote`s built-in themes for cohesive looks.
  • Data Linking: Pull from spreadsheets for auto-updates in live sessions.

A venture capitalist used our growth model template to simulate funding scenarios, morphing charts that projected ROI paths vividly.

Diverse Use Cases in Professional Settings

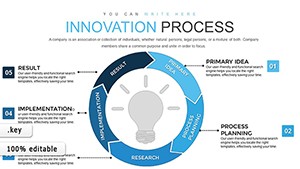
Model charts transcend industries; in consulting, they blueprint client transformations, segmenting phases into actionable models. Educators leverage them for case studies, like economic models illustrating supply-demand curves interactively.

Product managers chart user journeys, with funnels modeling conversion drops. Non-profits apply impact models to donor reports, quantifying outreach effectiveness through layered diagrams.

Business and Strategy Focus

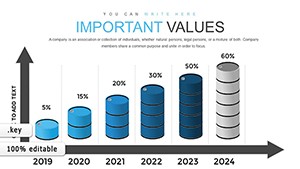
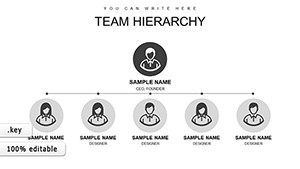
For enterprises, balanced scorecard models track KPIs across perspectives - financials in bold reds, learning in greens. Startups favor lean canvas templates, condensing plans into one-slide overviews that pitch-ready.

One innovation lab credited our templates for accelerating prototype feedback, as visual models clarified iterations swiftly.

Beyond Basics: Model Charts vs. Generic Options

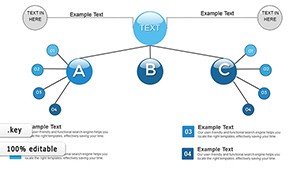
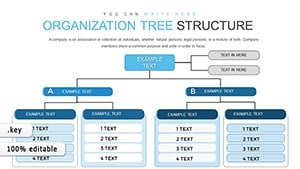
Generic Keynote charts suffice for simples, but falter on interconnections - our models weave threads, like dependency arrows in a RACI matrix. Defaults often rigidify; these flex with your logic, supporting conditional formatting for scenario what-ifs.

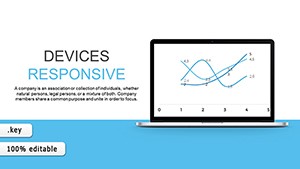
The depth? Embedded formulas calculate on-the-fly, turning static slides into live dashboards.

Pro Tips for Mastery

  1. Layer Logically: Base models on foundations, overlay variables atop.
  2. Color Narratively: Progress from cool to warm tones to signal advancement.
  3. Test Transitions: Ensure Magic Moves align elements precisely.
  4. Annotate Sparingly: Use callouts for emphasis, not explanation.

Implementing, a strategy session saw a PESTLE model animate external factors, sparking proactive pivots.

Inspiring Examples from Real Applications

Envision a sustainability report: A circular economy model with recycling loops, Keynote`s builds unveiling circular flows. Or HR talent models mapping career ladders, branches growing with promotions simulated.

These templates inspire hybrids - like fusing fishbone with flowchart for root-cause deep dives.

Enhancement Ideas

  • Integrate Keynote shapes with custom paths for unique model forms.
  • Add hyperlinks to detailed appendices within models.
  • Export as interactive PDFs for post-presentation sharing.

Select a template and model your success story.

Frequently Asked Questions

Addressing your model Keynote chart curiosities.

Eager to model excellence? Download model Keynote chart templates now.