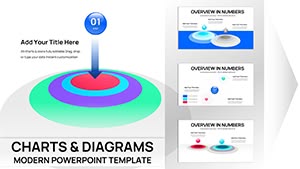
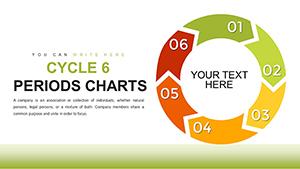
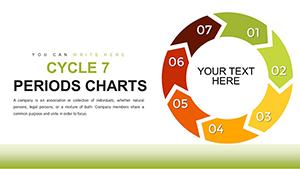
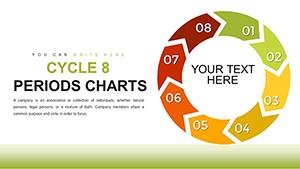
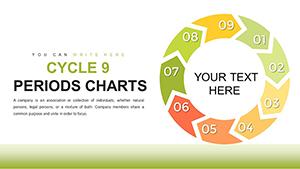
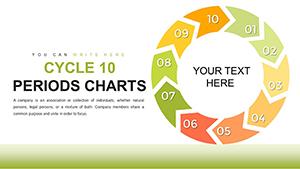
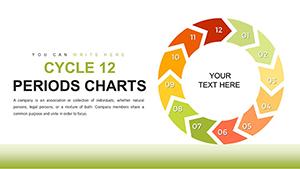
Outline methodologies with clarity using our method PowerPoint chart templates, geared toward trainers, consultants, and operations experts. These charts employ stepped bars and cycle diagrams in structured greens and grays, delineating phases from planning to execution.
For methodology overviews or training decks, they provide logical progression, with editable segments for tailoring steps. Animate transitions to simulate method advancement, keeping learners hooked.
Implement methods that stick. Investigate our chart series for methodical mastery.
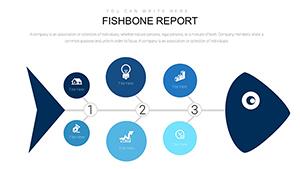
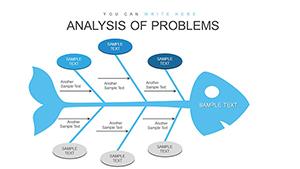
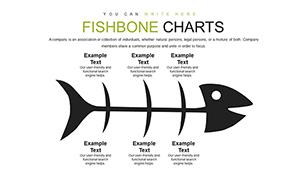
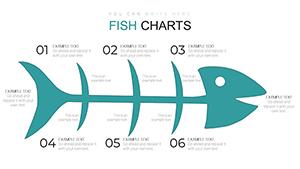
Cause and Effect Fishbone PowerPoint Charts Template: Unravel Issues Effortlessly
ID: #PC00732
$18.00
(88)
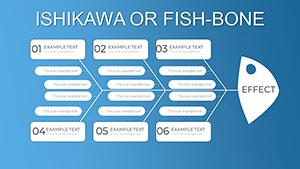
Analysis Ishikawa Fishbone PowerPoint Charts Template: Master Root Cause Analysis
ID: #PC00731
$22.00
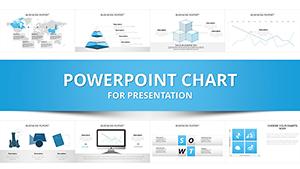
Charting Success with Method Templates
Method charts in PowerPoint crystallize approaches, from agile sprints to scientific protocols, enabling precise communication of sequences and dependencies.
They streamline adoption, with adopters reporting clearer implementations post-presentation.
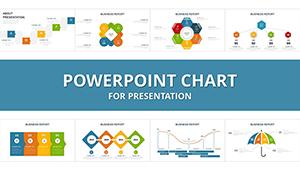
Diverse Applications for Method Visualization
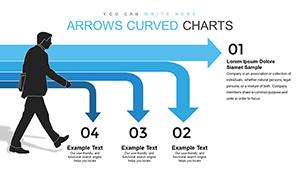
Business Processes: Gantt variants for project methods, bars linking milestones.
Research Protocols: Step pyramids building hypotheses to conclusions.
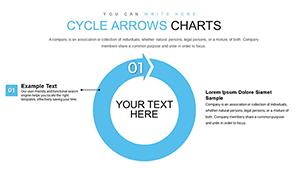
Training Modules: Accordion charts expanding sub-methods on click.
Ahead of defaults, ours integrate conditional formatting for status updates.
Optimizing Charts for Methodological Depth
Match chart forms to method complexity - linear for simples, networked for interlinks. Fine-tune axis labels for precision and shade phases by duration.
Exclusive: Parametric equations for custom curves in flow methods. Counsel: Sequence reveals to mirror method logic.
Exemplary Uses to Emulate
Lean Implementation: Value stream maps as meandering rivers, charting waste eliminations.
Design Thinking: Empathy maps radiating from user centers, charting ideation branches.
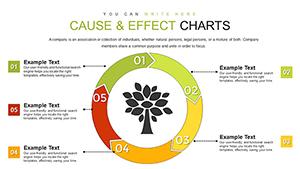
Quality Control: Control charts trending variances, methodically flagging deviations.
These catalyze buy-in. Slot CTAs in chart footnotes, urging "Apply Now."
Refining Engagement in Method Presentations
Charts demystify methods via familiarity, with progress bars tracking session advances. Include voiceover scripts for self-paced learning.
They trump generics with method taxonomies and interactive toggles. Advance: Fuse with timelines for hybrid method histories.
Method forward - examine our PowerPoint chart templates and download to chart your course.