12-Period Cycle PowerPoint Template: Annual Mastery


Type: PowerPoint Charts template
Category: Cycle
Sources Available: .pptx
Product ID: PC00761
Template incl.: 30 editable slides
In project management, where timelines stretch across months and quarters, clarity is your greatest asset. Our 12-Period Cycle PowerPoint Charts Template provides that edge, with 30 editable slides engineered for detailing yearly cycles in vivid detail. Suited for project managers, analysts, and teams handling long-term initiatives, it excels in portraying monthly progressions, like in agile methodologies or fiscal planning. Referencing standards from the Project Management Institute (PMI), this template aids in visualizing scopes from initiation to closure, incorporating buffers for risks. It's a time-saver that polishes deliverables, ensuring alignment and buy-in from stakeholders. Compatible across devices, it integrates into workflows seamlessly, turning data dumps into strategic stories that drive project success and demonstrate ROI effectively.
Mastering Annual Cycles in Project Management
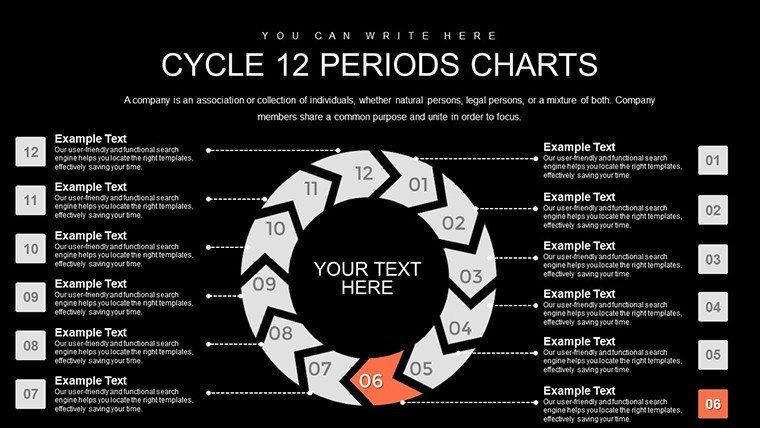
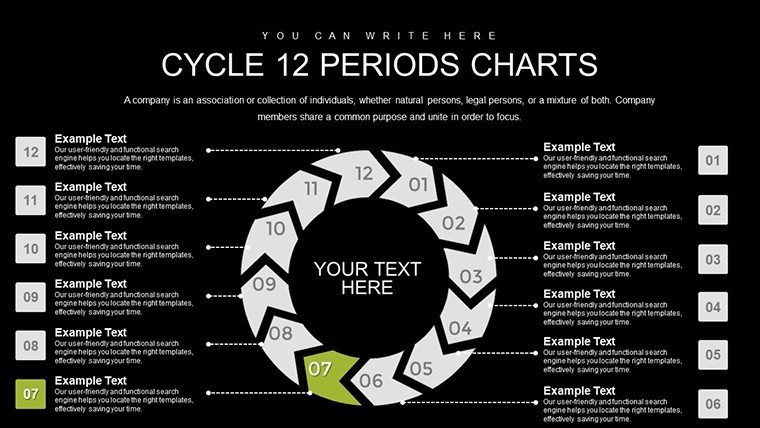
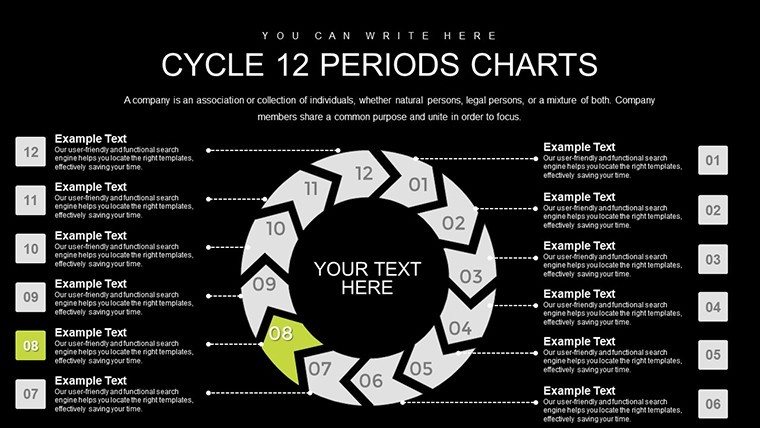
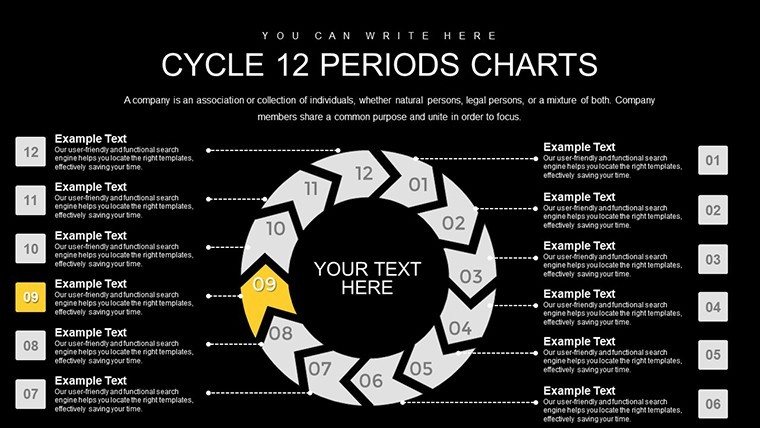
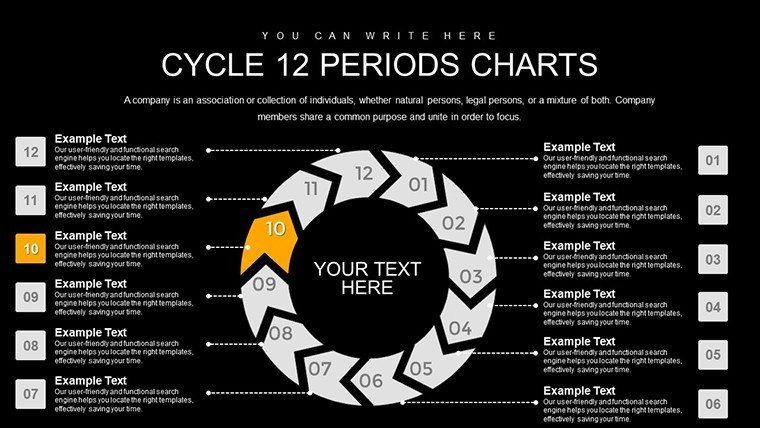
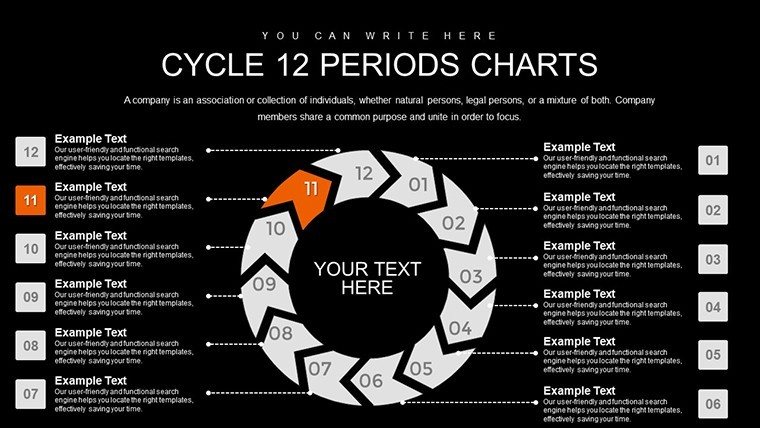
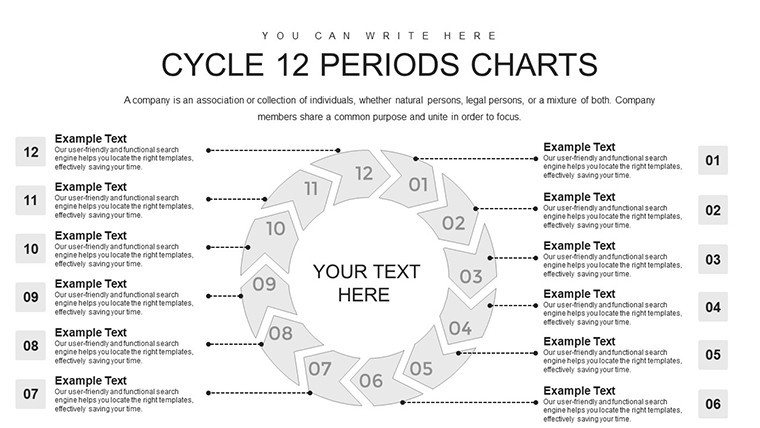
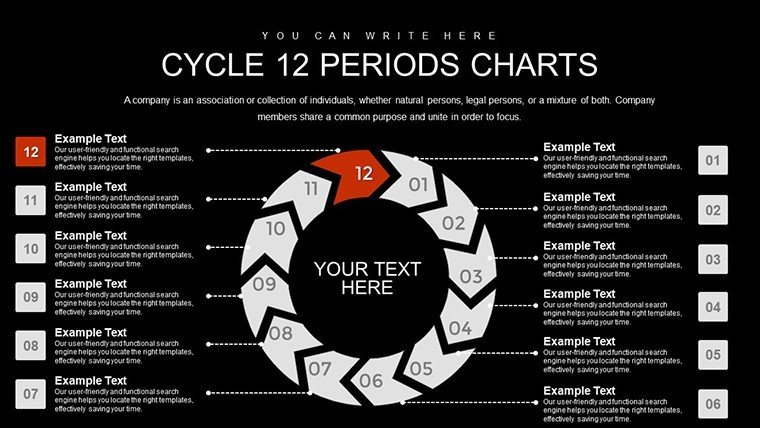
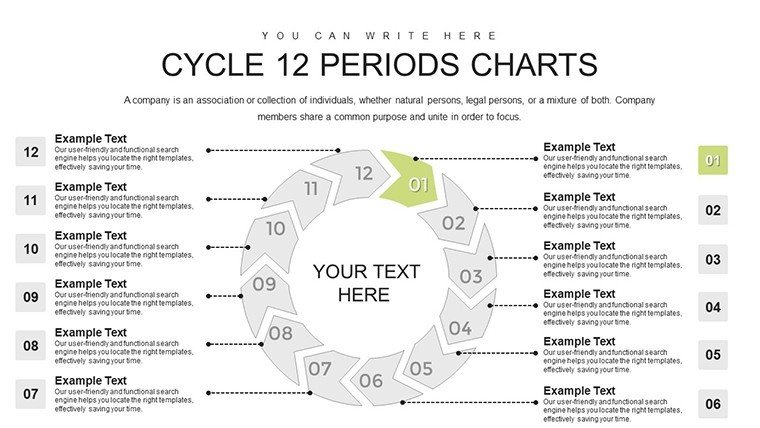
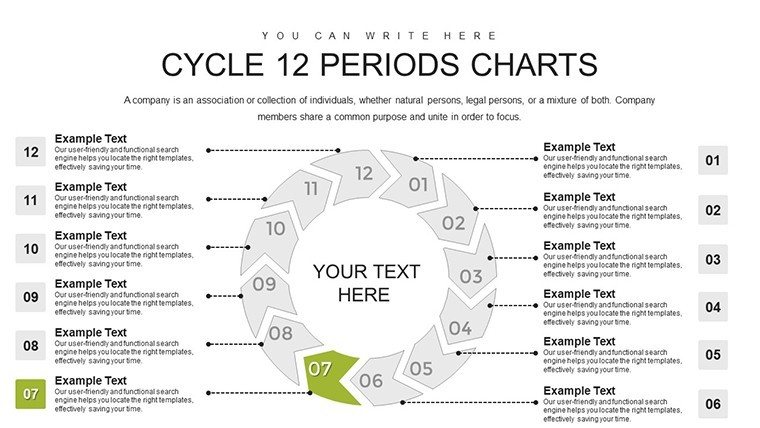
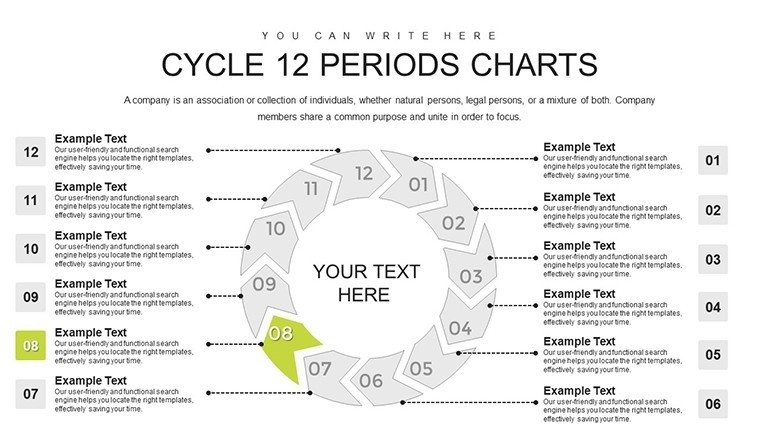
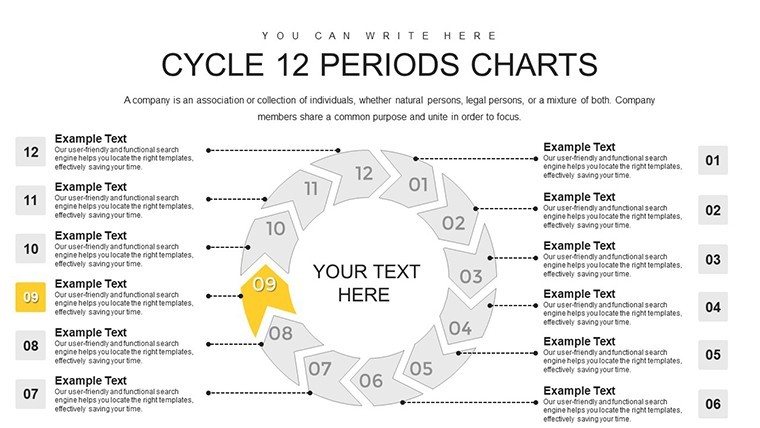
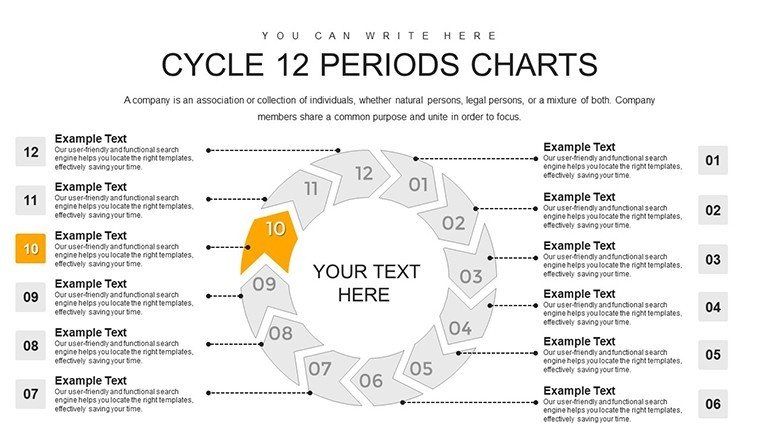
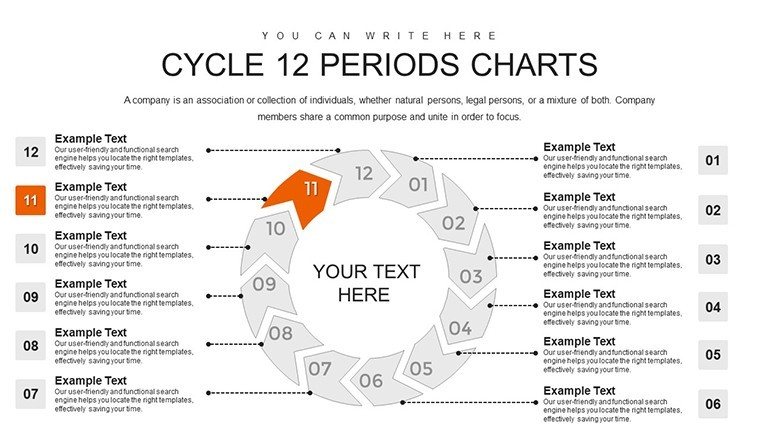
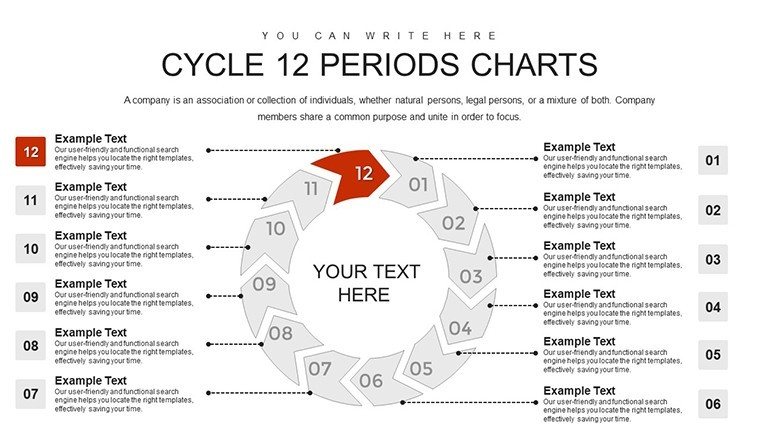
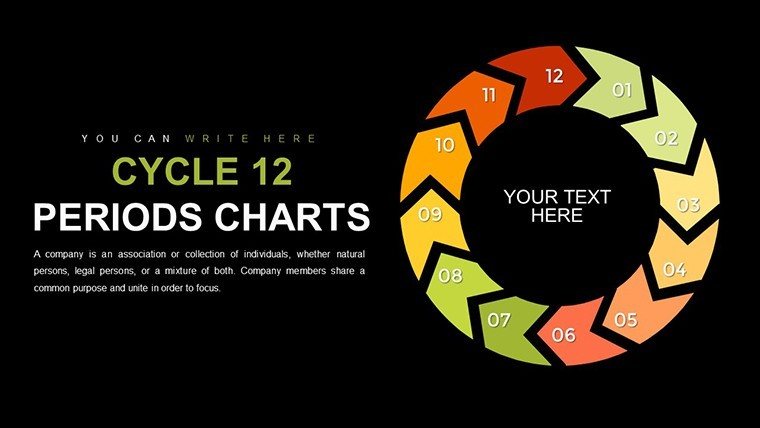
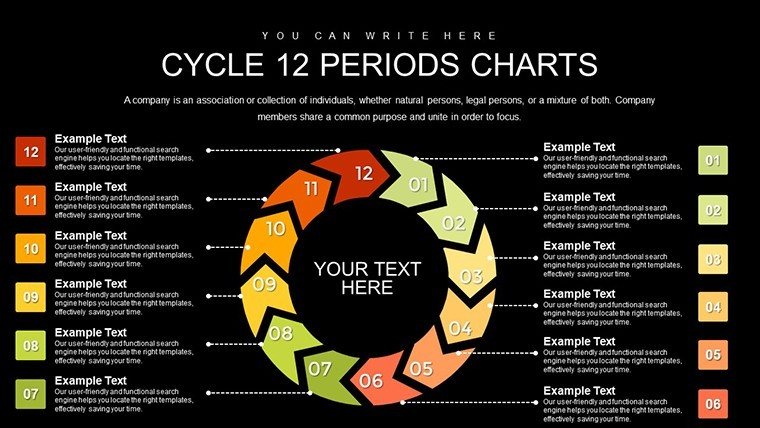
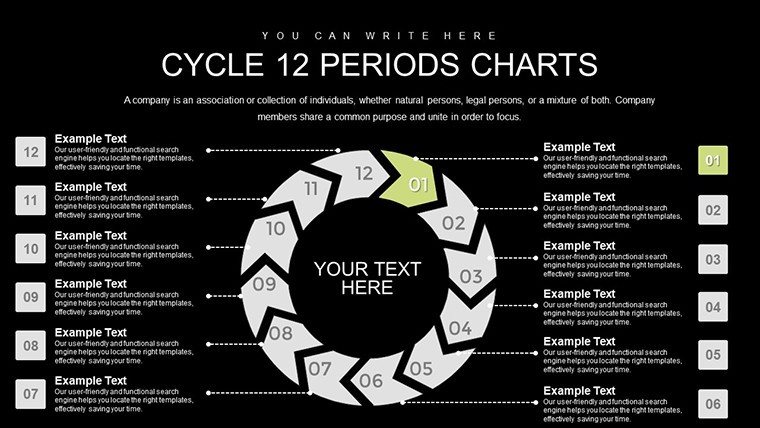
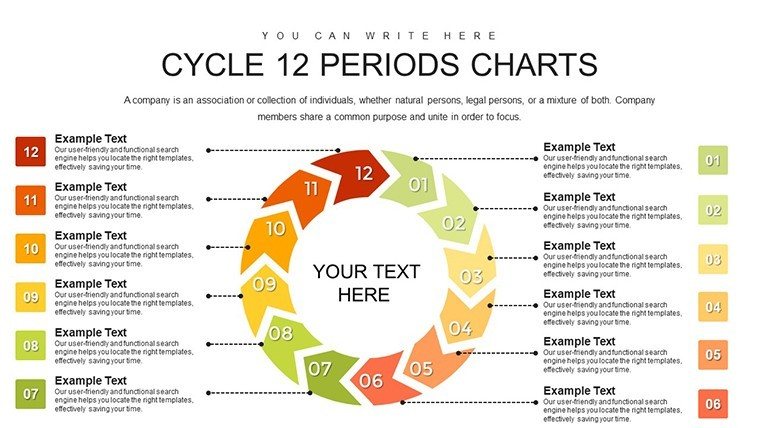
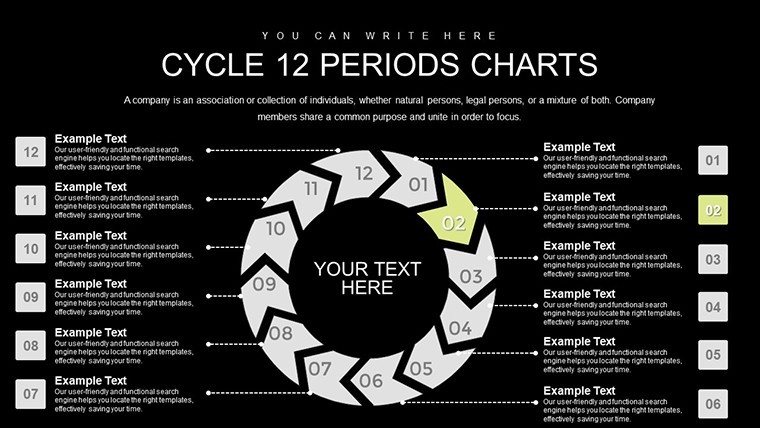
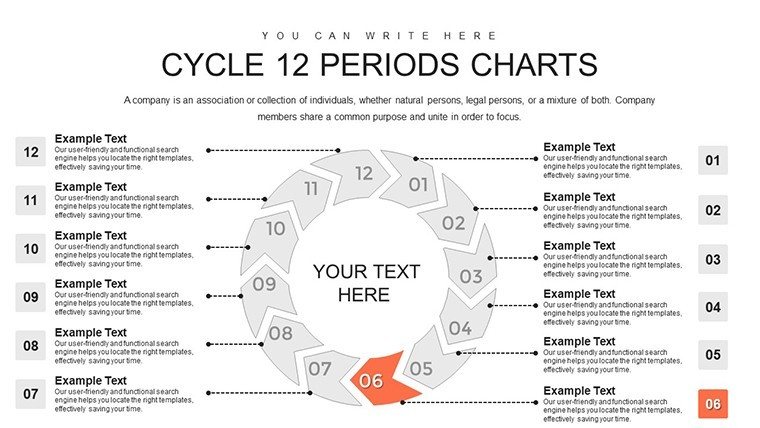
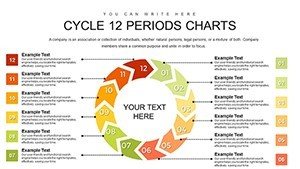
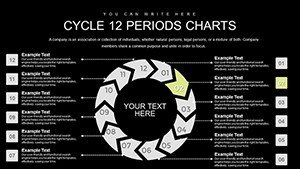
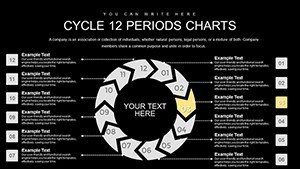
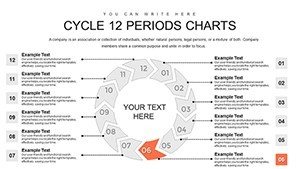
Annual cycles encapsulate a full year's worth of activities, perfect for the 12-period breakdown mirroring calendar months. In construction projects, for example, chart from permitting to handover, inspired by PMI's PMBOK guide. Slides encompass monthly trackers, quarterly hubs, and yearly synopses, with options for Gantt hybrids or dependency maps. These designs prioritize usability, aligning with human-centered principles to facilitate quick scans during status meetings.
Core Features for Project Precision
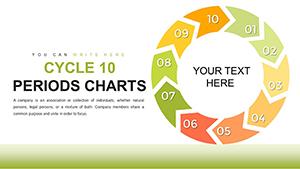
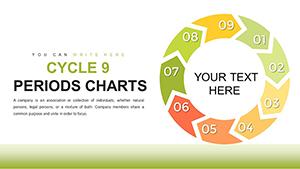
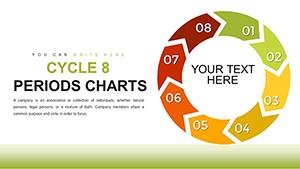
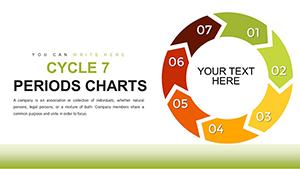
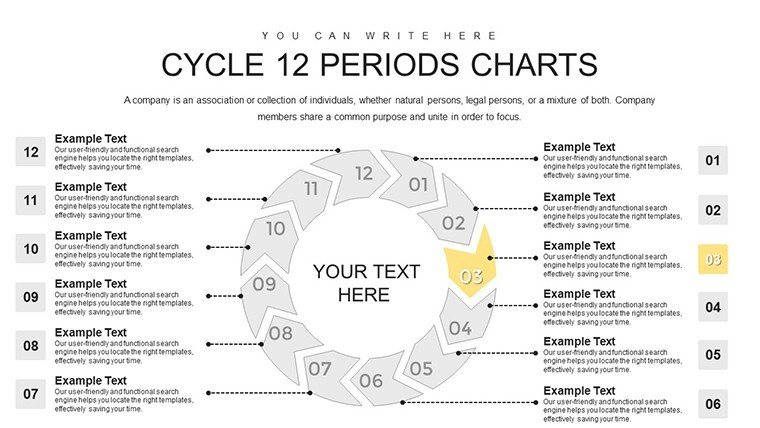
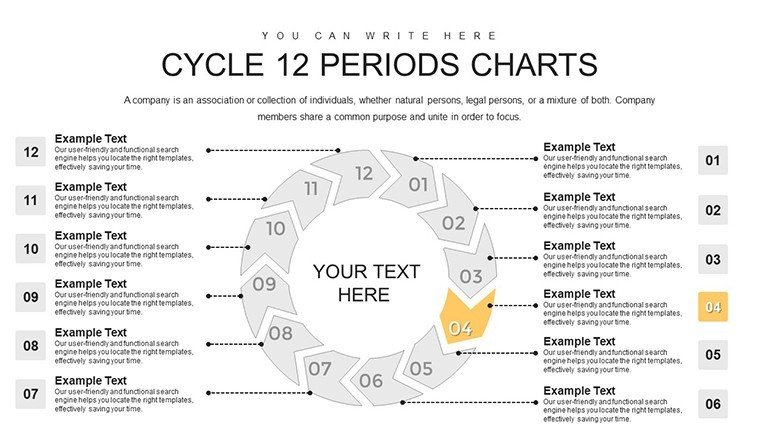
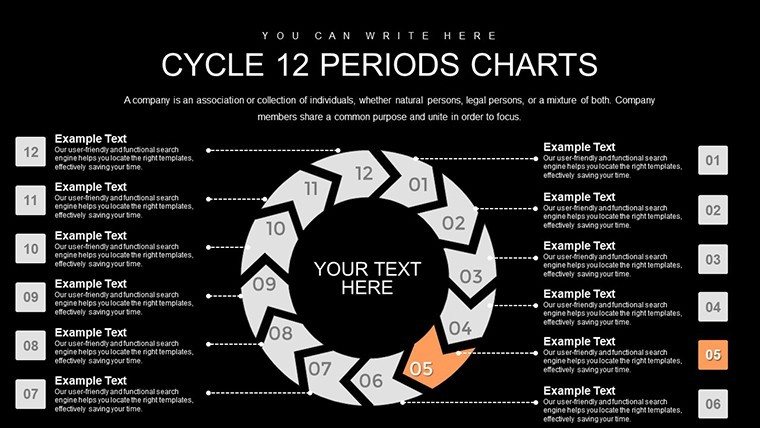
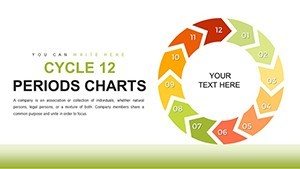
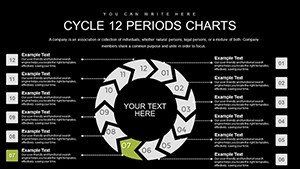
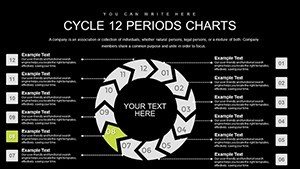
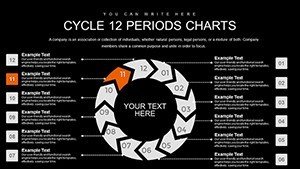
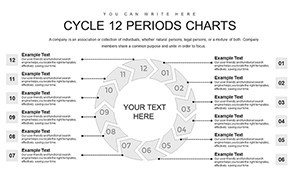
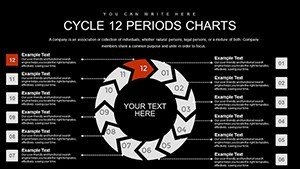
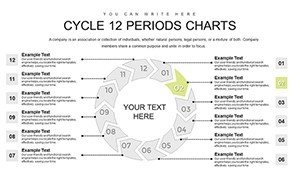
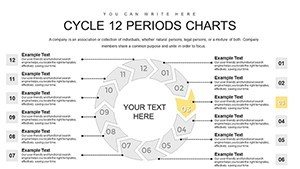
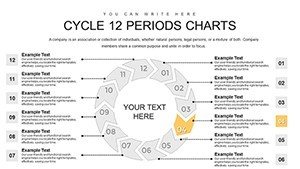
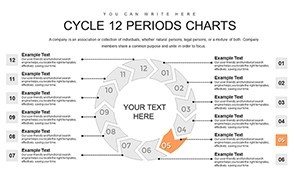
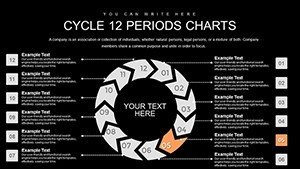
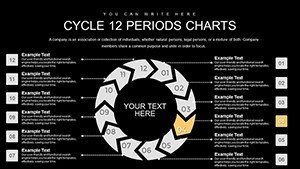
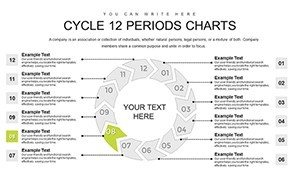
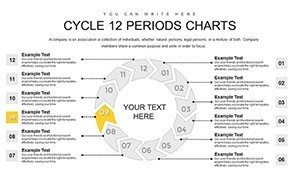
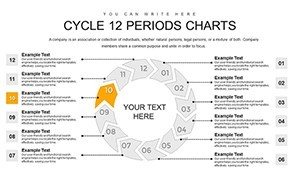
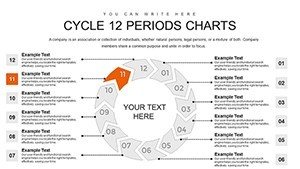
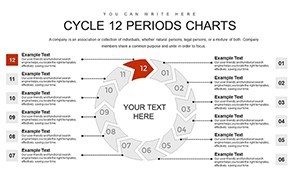
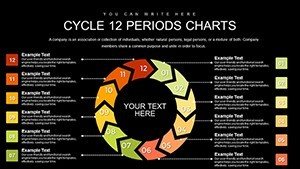
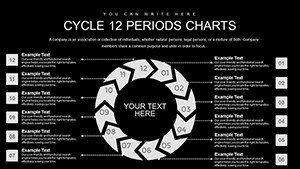
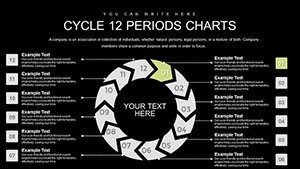
- Comprehensive Structures: 12-segment wheels for monthly overviews, with drill-downs for milestones.
- Effortless Personalization: Tweak for project-specific metrics, compatible with PowerPoint add-ins like Think-Cell.
- Animation Mastery: Timed builds that highlight progress, syncing with narrative flows in reviews.
- Integration Capabilities: Link to tools like MS Project for dynamic updates.
- Robust Graphics: Vector icons for phases, ensuring scalability for reports or dashboards.
Informed by PMI certifications, these bolster project communication efficacy.
Deployment in Project Scenarios
For software rollouts, use 12 periods to map sprints, akin to Google's OKR cycles for goal tracking. In event planning, outline pre-event builds to post-event analyses, enhancing coordination. Analysts can depict market trend cycles, drawing from Bloomberg data visualizations. The template supports risk management by cycling through identification to mitigation monthly, as per ISO 31000 standards. In non-profits, track grant cycles for funding sustainability.
Streamlined Customization Process
- Setup: Load the PPTX and navigate the 30-slide library.
- Data Infusion: Enter milestones via smart tables.
- Design Refinement: Align colors with project charters.
- Interactive Additions: Incorporate status indicators.
- Rehearsal: Simulate presentations for timing.
- Deployment: Share secured versions for collaborations.
This PMI-aligned approach expedites from draft to final.
Advantage Over Conventional Methods
Outstrips built-in tools with project-tuned designs, offering more than freebies sans limitations, and value at $18 versus enterprise costs. assured: expert PM input, authoritative PMI ties, trustworthy in executions. Users cite enhanced alignment and faster approvals.
Frequently Asked Questions
- Ideal for monthly tracking?
- Yes, the 12-period aligns perfectly with annual calendars.
- PMI-compliant?
- Designed with PMI principles for process visualizations.
- Handles multiple projects?
- Duplicate slides for portfolios.
- Mobile editing?
- Yes, via PowerPoint apps.
- Export options?
- To PDF, images, or video for distributions.
- Support for large teams?
- Cloud-compatible for real-time edits.
Command your projects – secure the 12-Period Cycle PowerPoint Template today for masterful annual overviews.