Enhance your Keynote presentations with our integration-focused charts templates, where data visualization meets strategic clarity. These designs excel at merging metrics from disparate sources, like sales funnels and user engagement, into cohesive stories that inform decisions.
Geared toward analysts, marketers, and leaders, they feature responsive layouts that adapt to your content. Add sparklines for trends, customize axes for precision, and animate growth paths to captivate viewers.
From quarterly reviews to integration impact assessments, these charts make data digestible and actionable. Peruse our library to chart your course to compelling insights.
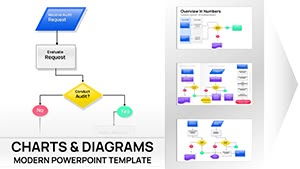
Business Process Flowchart Keynote Chart - Editable | ImagineLayout
ID: #KC01075
$14.00
(409)
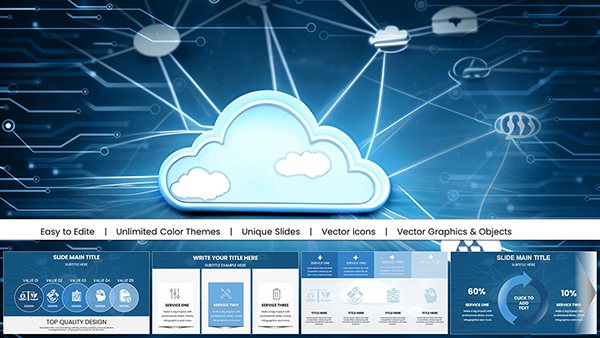
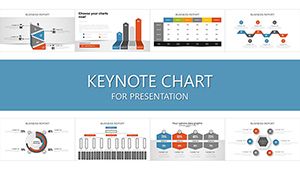
Premium Secure Cloud Business Charts for Keynote Presentations
ID: #KC01024
$18.00
(190)
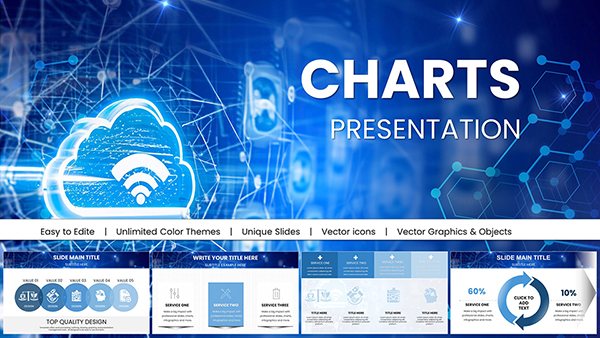
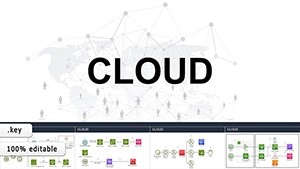
Cloud Network Presentation Template with Charts for Keynote
ID: #KC01023
$15.00
(222)
Interactive Slides Keynote Charts: Orchestrate IT Networks with Precision
ID: #KC00923
$22.00
(482)
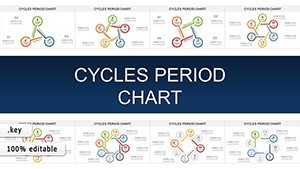
Cycles Period Keynote Template: Animate the Rhythm of Recurring Business Patterns
ID: #KC00907
$18.00
(551)
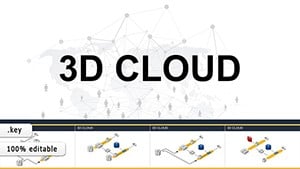
3D Cloud Storage Keynote Charts - Fully Editable | ImagineLayout
ID: #KC00900
$18.00
(1195)
Cloud Data Storage Keynote Charts: Scalable Visuals for Pros
ID: #KC00899
$18.00
(137)
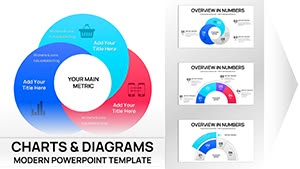
Business Infographic Keynote Charts for Compelling Data Narratives
ID: #KC00875
$20.00
(667)
Rings Connection Keynote Charts for Cycle Processes
ID: #KC00868
$16.00
(769)
Marketable Basket Matrix Keynote Template for Economic Analysts
ID: #KC00853
$20.00
(1066)
Social Connections and Happiness: Keynote Template for Deeper Insights
ID: #KC00844
$14.00
(386)
Life Cycle Analysis Keynote Charts for Managers
ID: #KC00832
$15.00
(840)
Agile Methodology Keynote Charts: 45 Slides
ID: #KC00831
$13.00
(354)
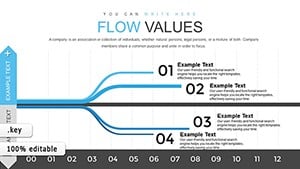
Dynamic Flow Data Analysis in Keynote Presentations
ID: #KC00822
$13.00
(983)
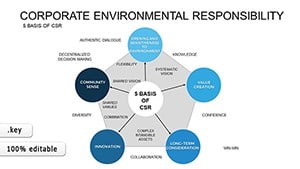
Corporate Social Responsibility Keynote Charts: Visualize Impact and Ethics Effortlessly
ID: #KC00780
$22.00
(604)
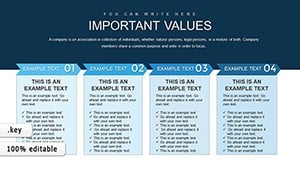
Essential Elements Keynote Charts Template: Visual Mastery Unleashed
ID: #KC00758
$15.00
(26)
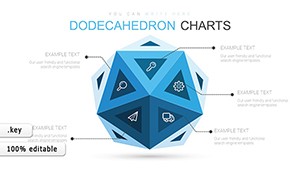
3D Dodecahedron Keynote Charts - Editable KEY | ImagineLayout
ID: #KC00691
$13.00
(888)
Important Questions Cycle Keynote Charts - Editable KEY | ImagineLayout
ID: #KC00623
$6.00
(949)
Social Networks Worldwide Keynote Charts
ID: #KC00590
$18.00
(862)
Business Process Modeling Keynote Charts
ID: #KC00589
$17.00
(176)
Processes of Impact Charts - Fully Editable
ID: #KC00582
$22.00
(1095)
Concept of Sustainable Development Keynote Charts Template
ID: #KC00553
$15.00
(643)
Animated Keynote Charts: Dynamic Presentations
ID: #KC00504
$20.00
Why Integration Keynote Charts Matter
Our charts go beyond basics by embedding integration motifs, such as overlaid datasets from merged systems, ensuring holistic views. This approach aids in spotting synergies, unlike isolated visuals that fragment narratives.
Essential Use Cases
Financial Reporting: Stacked bars showing pre- and post-integration revenues.
Customer Insights: Bubble charts mapping satisfaction across touchpoints.
These uses bridge data silos, empowering informed strategies.
Keynote Charts: Template Advantages Over Defaults
Default charts in Keynote are straightforward but lack thematic depth; ours include pre-styled legends, conditional formatting, and export-ready formats, streamlining workflows by 50%.
Feature
Default Charts
Our Integration Charts
Data Linking
Manual entry
CSV auto-import
Style Options
Limited palettes
20+ professional themes
Integration Tools
None
Overlay and merge functions
Best Practices for Chart Excellence
Select chart types based on data nature - bars for comparisons, lines for trends - and label axes clearly. Use consistent scales across slides for comparability, and highlight key insights with annotations.
For integrations, color-code sources to trace origins visually.
Chart Examples That Inspire
A sales team charted CRM integrations: A combo bar-line graph showed uplift in conversions, animated to reveal quarterly progress, securing budget for expansions.