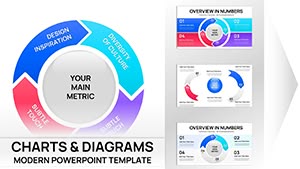
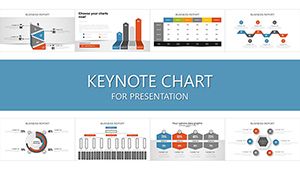
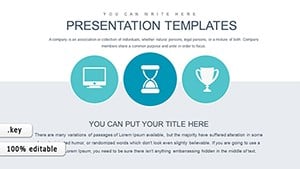
Transform abstract thoughts into structured visuals with our idea charts for Keynote. Geared toward innovators, designers, and workshop facilitators, these templates make brainstorming sessions productive and visually stunning.
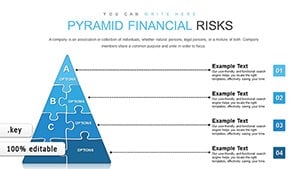
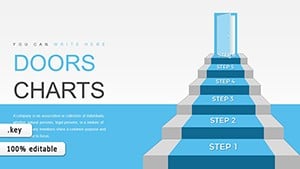
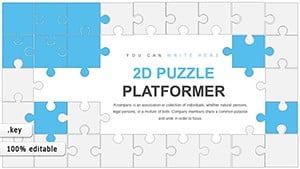
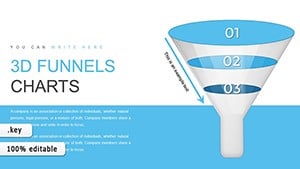
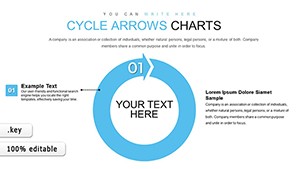
From radial mind maps radiating core concepts to sequential flowcharts mapping idea evolution, each chart encourages free-flowing creativity. Easily branch out sub-ideas, color-code themes like feasibility or impact, and animate paths to reveal connections dynamically. Our designs draw from design thinking principles, ensuring logical progression without rigidity.
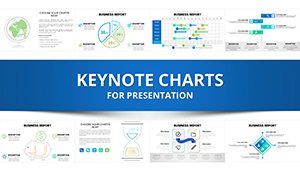
Suited for startup pitches outlining product roadmaps or educators guiding student projects, these charts foster collaboration and clarity. With one-click edits in Keynote, you`ll refine visions swiftly. Explore our selection and chart your next big idea today.
Plain text lists fade into the background, but our charts capture attention and aid retention. Co-created with UX experts, they feature ergonomic layouts that mimic natural thought patterns, reducing cognitive load during ideation.
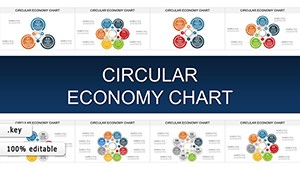
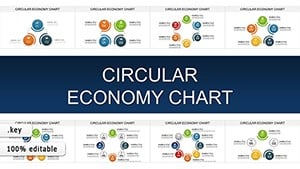
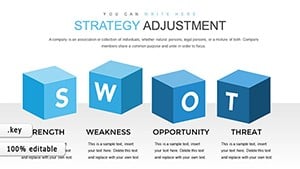
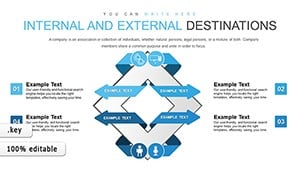
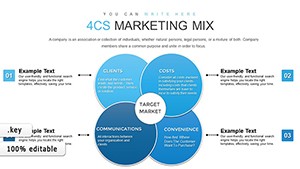
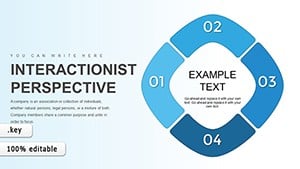
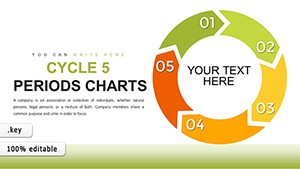
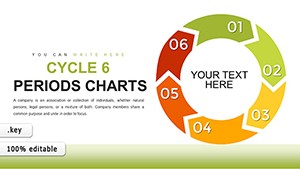
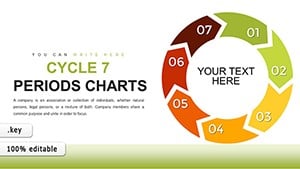
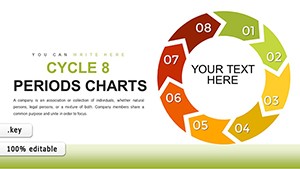
Take the Concept Wheel template: Centralize a main idea, then spin out segments for pros, cons, and variants - perfect for design reviews. Consultants use affinity diagrams to cluster client feedback, revealing patterns at a glance.
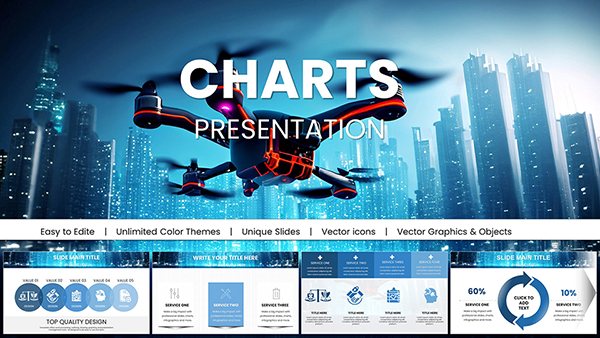
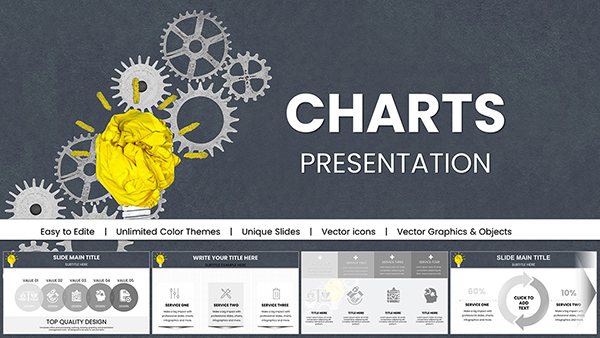
Outshining Keynote`s native tools, ours include preset icons and gradients, streamlining from sketch to slide.
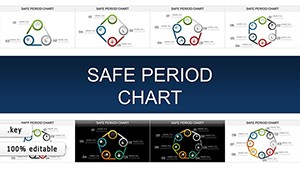
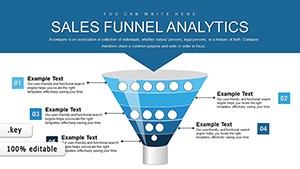
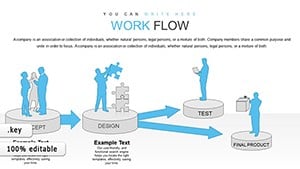
Product managers map user journeys, branching pain points into solution trees. In advertising, storyboards evolve from rough sketches to polished narratives using linear idea chains.
Therapists employ empathy maps to dissect client perspectives, with quadrants for says, thinks, does, and feels. Writers outline plots with plot-point diagrams, timing twists for pacing.
Such applications turn solo musings into shareable assets, amplifying group synergy.
Anchor your chart to a single slide for focus, using Keynote`s magic move to transition between iterations. Incorporate diverse icons from our library to symbolize ideas vividly, and test readability by printing drafts.
For virtual meetings, enable presenter notes with facilitation prompts. Balance density - limit branches to seven for Miller`s Law compliance. Export as PDFs for handouts, preserving interactivity.
Bonus: Layer audio annotations for asynchronous feedback loops.
A tech firm brainstormed app features via a fishbone diagram, tracing problems to root causes and netting a patent. Event planners sketched themes in mood boards, evolving into cohesive visions that wowed clients.
Authors visualized character arcs with arc plots, ensuring emotional depth. These cases show charts as catalysts for tangible outcomes.
Yes, backward-compatible for seamless use.
Easily link to supporting docs or images.
Extensive sets for thematic representation.
Use build orders for sequential reveals.
iCloud sync enables real-time teamwork.
Unlock your creative potential - download idea charts and start visualizing success immediately.
Copyright © 2009-2026 ImagineLayout All rights reserved.