Our curated selection of editable PowerPoint Europe map templates offers detailed views of the continent, individual countries, and EU member states. Ideal for business professionals tracking European markets, educators covering regional history, or planners mapping travel and logistics across borders.
These high-quality, vector-based designs allow full customization - change colors to highlight specific nations, add location pins, or integrate data for compelling visuals. Modern and clean aesthetics ensure your slides remain engaging and easy to follow.
From broad continental overviews to focused country breakdowns, find templates that fit your needs perfectly. Elevate your presentations with accurate, professional Europe maps today.
Czech Republic PowerPoint Maps: Editable Professional Templates for Insightful Presentations
ID: #PM00183
$48.00
(343)
Belgium PowerPoint Maps Template: Chart European Elegance
ID: #PM00178
$55.00
(1088)
Austria PowerPoint Maps Template: Precision Meets Elegance
ID: #PM00177
$55.00
(1133)
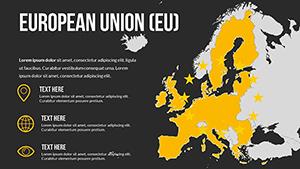
Editable EU Maps PowerPoint Template: 61 Slides
ID: #PM00175
$58.00
(1085)
EU Countries PowerPoint Maps Template - High-Quality PPT
ID: #PM00174
$35.00
(826)
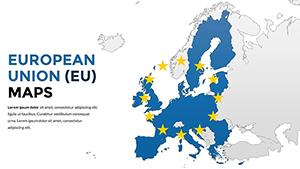
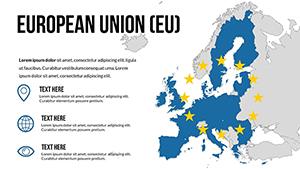
EU PowerPoint Maps Template - Customizable & Detailed
ID: #PM00173
$35.00
(1038)
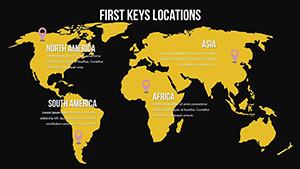
Global Market Maps PowerPoint Template: Chart Your Worldwide Vision
ID: #PM00170
$25.00
(788)
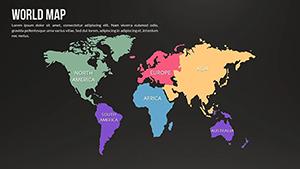
World Country Maps PowerPoint Template - Enhance
ID: #PM00168
$26.00
(773)
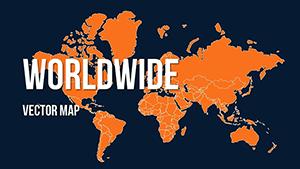
PowerPoint Maps Template for Global Data
ID: #PM00164
$20.00
(150)
World Map PowerPoint Template Download Editable Slides
ID: #PM00163
$20.00
(792)
World Countries PowerPoint Maps: Download PPT
ID: #PM00162
$20.00
(469)
Business Maps of the World for PowerPoint - Editable PPT Templates
ID: #PM00161
$20.00
(117)
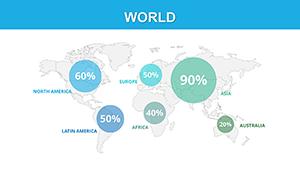
World Global PowerPoint Maps: 18 Editable Slides
ID: #PM00160
$30.00
(109)
Continents World Map PPT Template: Download Now
ID: #PM00088
$14.00
(988)
Political World PowerPoint Maps Template: Global Geopolitics at Your Fingertips
ID: #PM00086
$20.00
The Value of Europe-Focused Maps in Slides
Europe's diverse nations and integrated unions make specialized maps essential for clear communication. Editable templates provide flexibility to emphasize EU zones, trade blocs, or cultural regions effectively.
Popular Applications for Europe Map Templates
Business Expansion: Map sales territories, distribution networks, or market opportunities across Western and Eastern Europe.
Economic Analysis: Visualize GDP, unemployment, or industry concentrations by country.
Political Discussions: Highlight EU members, Schengen areas, or election outcomes with precise borders.
Tourism and Culture: Plan routes through historic sites or showcase regional diversity.
Superior Features of These Templates
Enjoy individual country shapes for easy selection, pre-labeled capitals, and options for flags or data callouts - far more versatile than fixed images.
Customization Tips for Europe Maps
Group related countries (e.g., Nordic or Balkan) with shared styling.
Use gradients or patterns for depth in economic or demographic data.
Add connection lines for trade routes or transportation networks.
Incorporate timelines alongside maps for historical context.
Compatible with recent PowerPoint versions, these 2025-updated designs include animated entrances and varied layouts. Transform data-heavy topics into visually memorable stories.
Frequently Asked Questions
Do templates include all European countries?
Yes, from Iceland to Turkey, with options to include or exclude non-EU states.
Can I highlight EU vs. non-EU countries?
Easily apply different colors or styles to distinguish membership status.
Are major cities and capitals labeled?
Many include pre-placed labels, fully editable for additions or removals.
Do these support data-driven charts?
Yes, integrate Excel-linked elements for automatic updates on maps.
Are there UK post-Brexit versions?
Updated designs reflect current political configurations accurately.
Can I create sub-regional maps, like Scandinavia?
Select and group specific countries or use dedicated regional templates.