Development Keynote Charts
Development charts map progress evolution and growth over time. Our collection of over 130 Keynote development chart templates provides linear curved and stepped designs to illustrate any journey.
These professional animated templates feature milestones timelines and growth indicators crafted for clarity and impact.
Completely customizable they adapt to business personal or product development stories with ease.
Perfect for strategic planning reviews and vision presentations in.
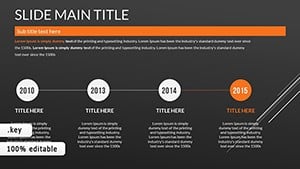
Conceptual Plan Keynote Charts - Fully Editable | ImagineLayout
ID: #KC01111
Pie Charts Keynote Template - 26 Fully Editable Slides | Instant Download
ID: #KC01094
Keynote Pie Chart Template - 26 Fully Editable Slides | Instant Download
ID: #KC01070
Pie Chart Keynote Template - 42 Fully Editable Slides | Instant Download
ID: #KC01067
Marketing Strategies Keynote Template - Professional Charts
ID: #KC01026
Data Visualization Keynote Charts Template: Illuminate Your Insights
ID: #KC01017
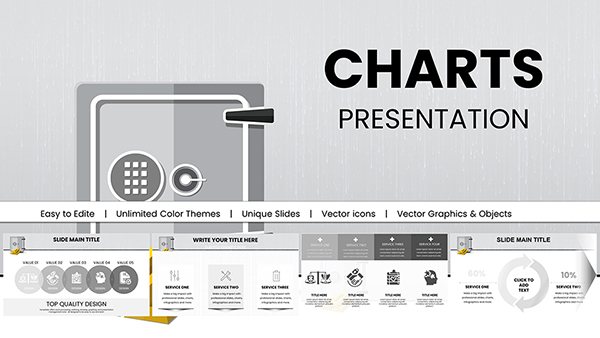
Bank Security Safeguarding: Keynote Charts for Financial Fortification
ID: #KC00981
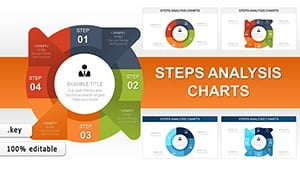
Steps Analysis Keynote Charts: Project Flows
ID: #KC00918
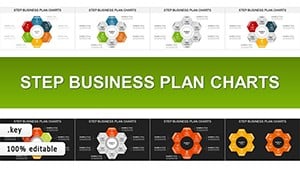
Step Business Plan Cycles: Keynote Chart Mastery for Ambitious Builders
ID: #KC00916
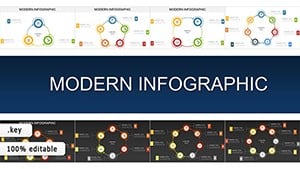
Modern Infographic Cycle Charts: Revolutionize Your Keynote Presentations
ID: #KC00913
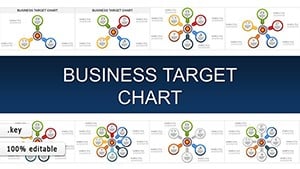
Business Target Keynote Charts: 38 Slide Template
ID: #KC00911
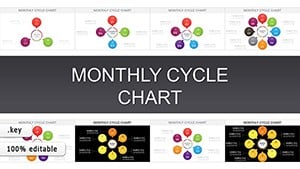
Monthly Cycle Keynote Charts: Track Progress with Precision
ID: #KC00910
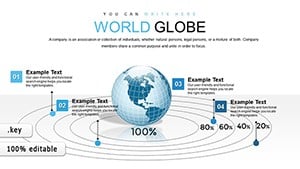
3D World Globe Model Keynote Charts: Visualize Global Data Dynamically
ID: #KC00791
Vision Mission Targets - Fully Editable | ImagineLayout
ID: #KC00783
Branching Service Tables Keynote Charts Template
ID: #KC00757
Vision Mission Strategy Charts - Editable | ImagineLayout
ID: #KC00740
Sales Analysis Keynote Charts - Fully Editable | ImagineLayout
ID: #KC00695
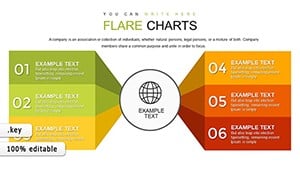
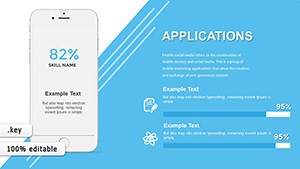
Applications Services Charts - Instant Download
ID: #KC00606
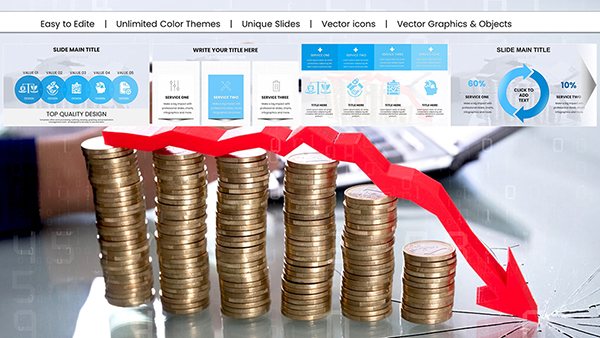
World Economic Situation Keynote Charts Template: Decode Crises for Resilient Strategies
ID: #KC00591
Goals and Opportunities Keynote Charts: Empower Your Journey
ID: #KC00564
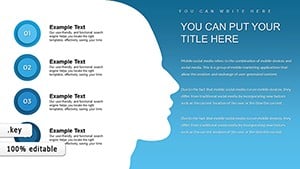
Employee Vision Plans Keynote Charts: Blueprint Your Team's Tomorrow
ID: #KC00535
Business Slideshow Keynote Charts Template
ID: #KC00524
Business Professional Keynote Charts Template
ID: #KC00519
3D Structure Keynote Charts - Fully Editable | ImagineLayout
ID: #KC00508
Strength of Development Charts Development visuals show not just where you are but how you got there and where you are headed. They build confidence and alignment across teams.
Our templates make these stories visually compelling with smooth progression animations.
Key Applications Product Roadmaps Display feature releases and milestones across quarters.
Business Growth Show revenue user or market expansion curves.
Personal Development Map skill acquisition or career progression stages.
Project Phases Illustrate initiation planning execution and closure.
Premium Template Advantages Multiple timeline styles horizontal vertical curved Milestone markers with icons Growth curve animations Color-coded phases Clean modern typography Best Practices for Development Charts Start with clear start and end points. Use consistent spacing. Highlight current position. Include projected future stages. Animate sequentially.
Our templates embed these principles for instant professional results.
Ready to map your growth story? Explore the development chart collection and download today.
Frequently Asked Questions What types of development charts are included? Timelines roadmaps growth curves Gantt-style and stepped progressions.
Can I add or remove stages easily? Yes. All elements are fully editable and duplicatable.
Are future projections supported? Yes. Dotted lines shaded areas and labels for planned phases are included.
Do you offer free development templates? Yes. Many free options available alongside premium collections.