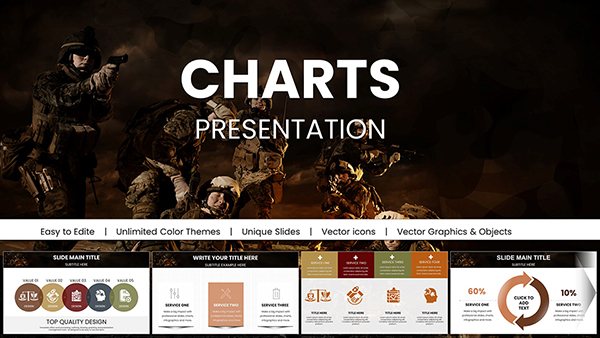
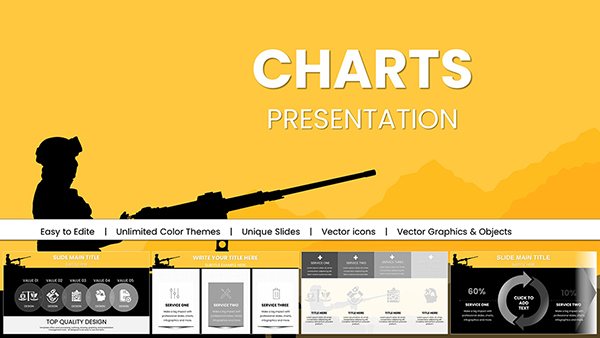
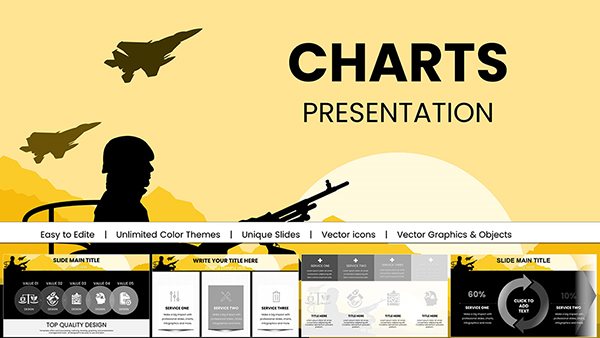
Charts are the backbone of data-driven presentations, turning numbers into narratives. Our contract collection of PowerPoint chart templates at ImagineLayout empowers analysts, managers, and educators to present information with precision and flair.
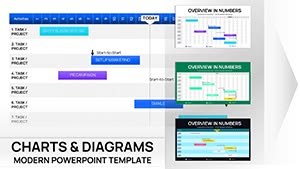
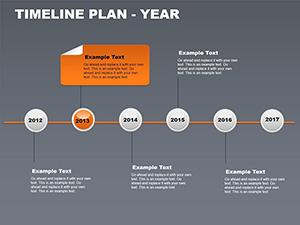
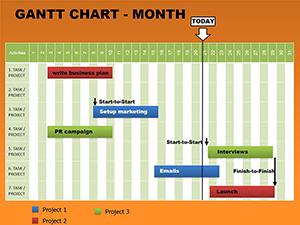
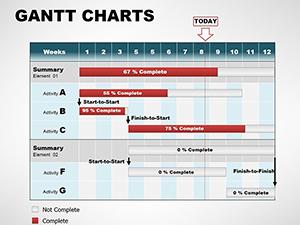
Ideal for quarterly reviews, academic lectures, or sales forecasts, these templates cover bar graphs, pie charts, timelines, and heat maps. Each includes editable data tables, color-coded legends, and animation sequences for step-by-step reveals.
Gain from features like Excel-linked updates for real-time changes, scalable vectors for large screens, and accessibility-compliant labels. Ditch cluttered defaults for charts that enhance comprehension and retention.
Scan our assortment and pick charts that match your dataset. Elevate your slides starting now.
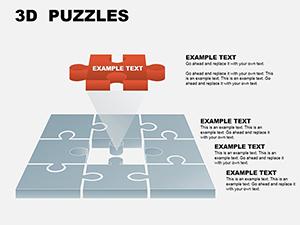
These PowerPoint chart templates shine with pre-formatted axes, trend lines, and error bars, streamlining complex datasets. Outperforming built-in tools, they integrate SmartArt enhancements and 3D options for depth without distortion.
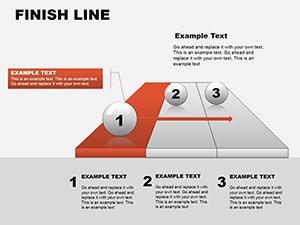
Finance pros and researchers appreciate the conditional formatting, auto-adjusting scales for varying data ranges. Key advice: Choose chart types wisely - lines for trends, scatters for correlations - and annotate sparingly for focus.
Add flair with gradient fills or icon overlays to denote categories. For interactive decks, embed hyperlinks to source data. These templates support dark mode adaptations for modern projectors.
Begin with audience needs - simplify for executives, detail for peers. Use consistent scales across series for fair comparisons. Experiment with combo charts blending bars and lines for multifaceted views.
Export as images for reports or keep native for edits. Teams report 40% faster prep times with these ready assets.
Curate your visual toolkit. Download and integrate seamlessly.
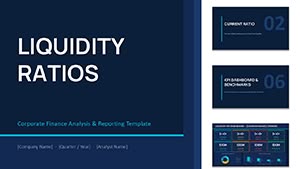
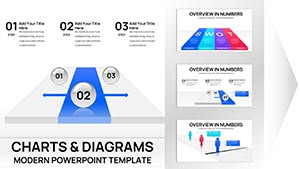
A full suite: bars, lines, pies, areas, radars, and specialized like waterfalls and sunbursts.
Edit via linked Excel sheets or directly in PowerPoint`s data editor for instant refreshes.
Yes, with entrance, emphasis, and exit effects adjustable per element.
Optimized for up to 10,000 rows, with aggregation tools for summaries.
All palettes pass WCAG contrast checks, with alt-text prompts for labels.
Easily save as PNG, SVG, or PDF for use in documents or web.
Make data dance. Secure your chart template and illuminate your story.
Copyright © 2009-2026 ImagineLayout All rights reserved.