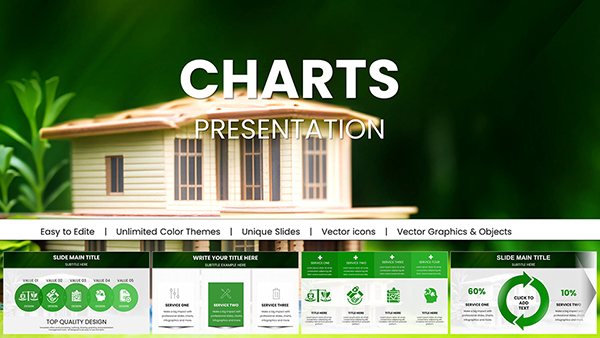
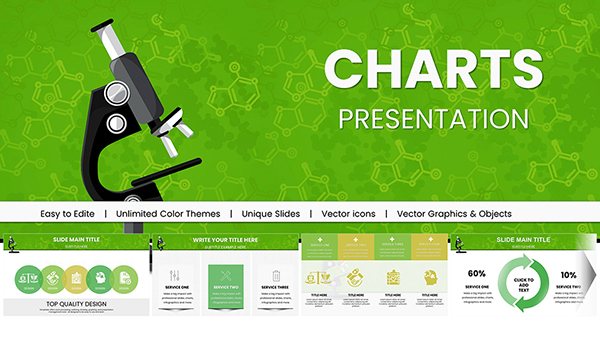
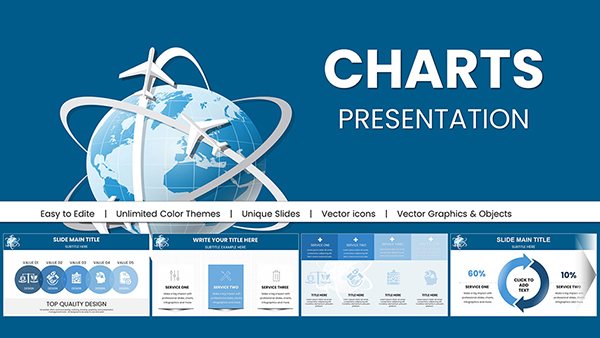
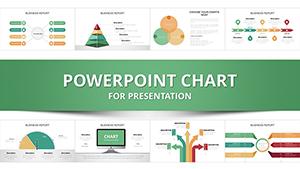
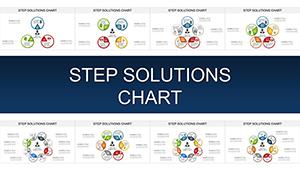
Business plan PowerPoint charts templates simplify complex data into compelling visuals, including trend lines, donut segments, and waterfall breakdowns for financial storytelling. Tailored for leaders presenting growth metrics or budgets.
With theme-consistent styling and animation presets, they make numbers narrative. Drag data from Excel, tweak axes, and watch insights emerge, ideal for boardrooms or investor calls.
Quantify your strategy effectively. Browse our charts collection and download assets that make data unforgettable.
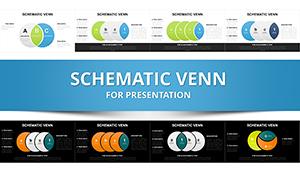
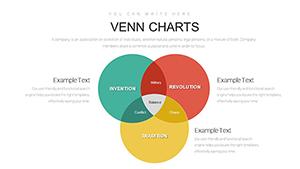
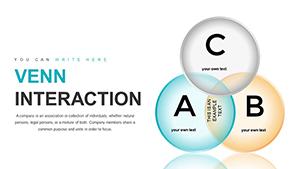
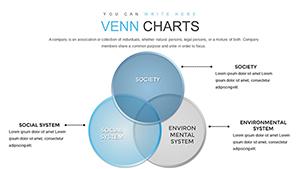
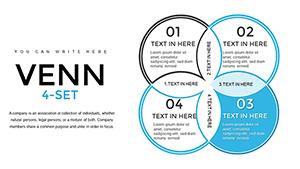
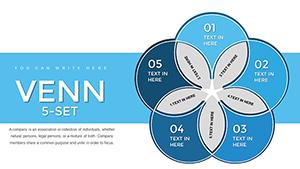
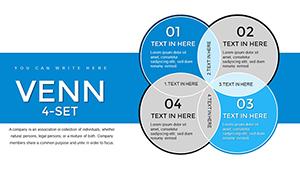
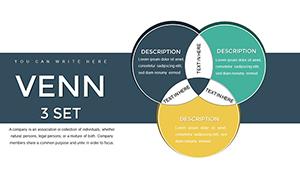
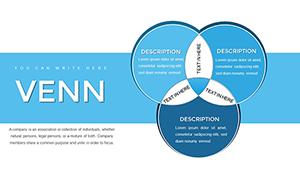
Professional Venn Diagram PowerPoint Template | Editable Charts for Business Presentations
ID: #PC00786
$22.00
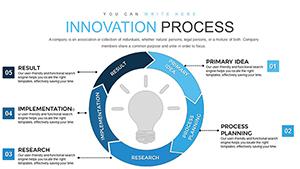
The Power of Charts in Business Narratives
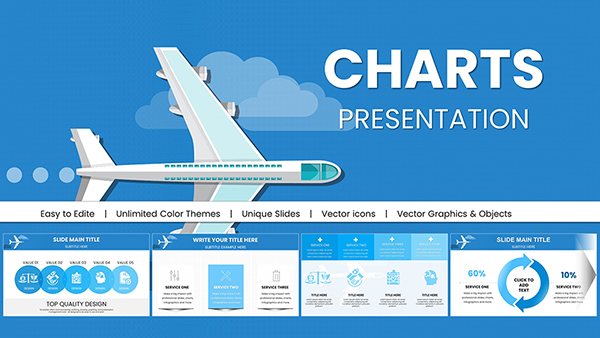
Superior to manual inserts, these templates auto-format axes and legends, ensuring professional polish. They include interactive tooltips for deeper dives during presentations.
Suited for analysts forecasting sales or marketers tracking ROI, they bridge data to decisions.
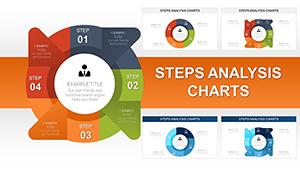
Variety of Chart Options
Line Graphs: For trajectory projections over time.
Bar Stacks: Segmenting revenue streams visually.
Scatter Plots: Correlating variables like cost vs. benefit.
Maintain clarity by limiting series and using contrasting hues, adhering to data viz fundamentals.
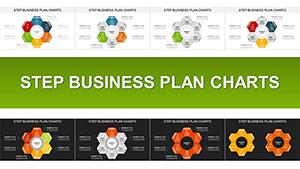
Chart Applications in Planning
Investment summaries leverage combo charts blending lines and bars for multi-metric views. Risk assessments use heat maps to color-code threats by severity.
Performance reviews feature gauge charts for KPI fulfillment, with thresholds triggering color shifts. Visualize a cash flow plan: cascading waterfalls depict monthly inflows and outflows dynamically.
Enhancement Strategies
Source data cleanly to avoid errors in updates.
Apply subtle animations for emphasis without overload.
Test on projectors for color fidelity.
These tactics amplify chart effectiveness in convincing stakeholders.
Bolster Your Presentation Suite
Integrate with diagram packs for complete visuals. Get your PowerPoint charts today and chart triumph.
Frequently Asked Questions
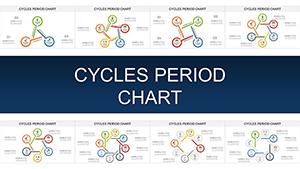
Which chart types suit financial plans?
Waterfalls for flows, pies for allocations, lines for trends.
How to link Excel data?
Paste special as linked objects for automatic refreshes.