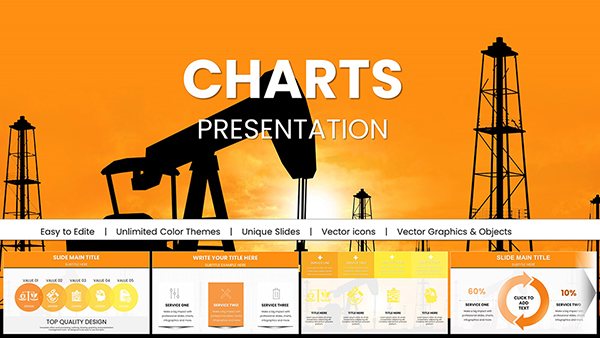
Drive engagement in your presentations with business movement Keynote chart templates. These charts illustrate market trends financial growth and operational metrics clearly for executives teams and analysts.
Fully editable and scalable they seamlessly adapt to corporate branding ensuring professional and impactful slides.
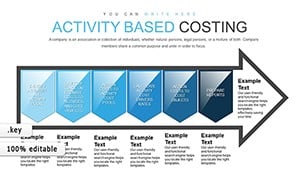
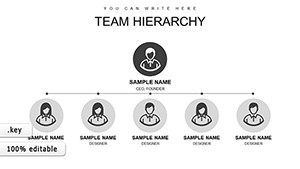
Time Management Keynote Charts for Marketers: Optimize Your Workflow
ID: #KC00720
$16.00
(1021)
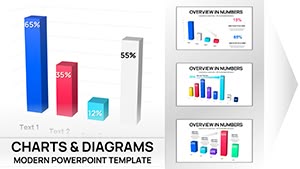
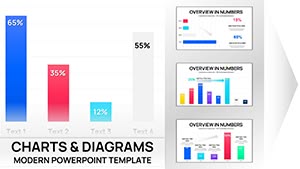
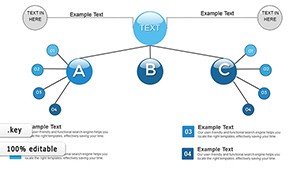
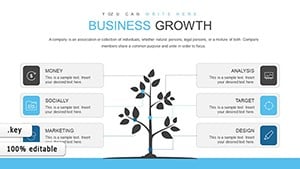
Sales Growth and Earnings: Chart Your Business Expansion
ID: #KC00697
$16.00
(122)
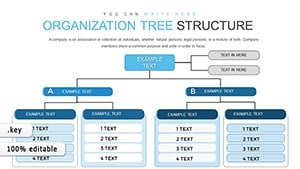
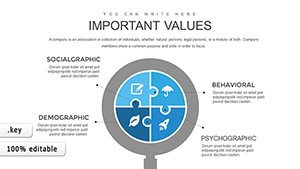
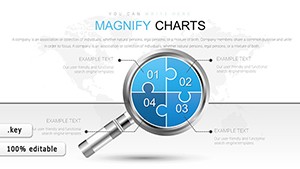
Editable Magnifying Glass Analysis Charts for Keynote
ID: #KC00688
$20.00
(434)
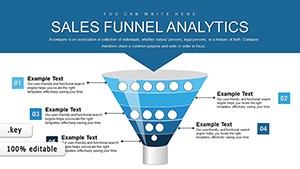
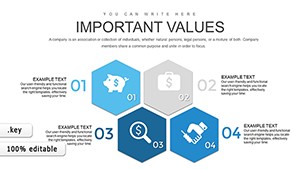
Investment Management Keynote Charts Template: Master Financial Narratives with Precision
ID: #KC00586
$20.00
(853)
Taxes and Accounting Keynote Charts Template
ID: #KC00570
$19.00
Transform Your Presentations with Business Movement Charts
Business movement Keynote charts enable clear visualization of growth trends and operational performance. Compared to default templates they provide editable layouts enhanced readability and professionally designed graphics.
Use Cases
Strategic Reports: Display market share and financial projections.
Marketing Presentations: Highlight campaign impact with animated charts.
Team Performance: Track KPIs and departmental results.
Investor Meetings: Convey complex data simply and effectively.
Benefits vs Standard Templates
Editable elements for complete customization.
Pre-designed layouts that save time.
Enhanced clarity with color-coded visuals.
Tips for Maximum Impact
Animate key metrics to emphasize growth.
Use gradient colors to show momentum trends.
Combine chart types for richer insights.
Explore our full collection and elevate your presentations with precise and compelling business visuals.
Frequently Asked Questions
Can I edit the charts to match my brand colors?
Yes all templates are fully editable including colors fonts and layout.
Are these charts suitable for executive presentations?
Absolutely designed to clearly communicate complex business data to executives.
Can I combine different chart types in one slide?
Yes combining charts is easy and enhances data storytelling.
Are these charts suitable for marketing reports?
Yes perfect for visualizing campaign results and market trends.