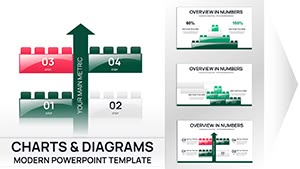
Lay strong bases with block Keynote chart templates, engineered for stacking insights and segmenting stories effectively. For briefers, builders, and briefers, these templates modularize content into digestible, expandable units.
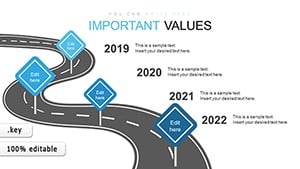
Spanning vertical lists to clustered arrays, they offer resilient structures that adapt to varying data loads, clarifying connections at a glance. Excellent for hierarchies or phased plans, they solidify your slide`s skeleton.
Harmonized with Keynote, featuring magnetic alignments and batch styling. Fitting for briefs, builds, or overhauls, they underpin persuasive power.
Step into block charts and cement a template for your foundation. Raise presentations on rock-solid visuals.
Analytical Accounting Keynote Charts Template: Illuminate Financial Data with Expert Visuals
ID: #KC00609
$19.00
(1186)
Data Analysis Graphs Keynote Charts Template
ID: #KC00597
$15.00
(676)
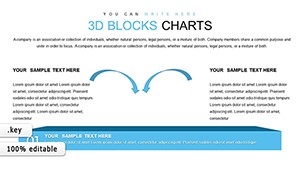
3D Dimensions: Structural and Volume Indicators Keynote Charts Revealed
ID: #KC00549
$20.00
(1189)
Analytical Skills Keynote Charts: Illuminate Data Insights
ID: #KC00537
$19.00
(643)
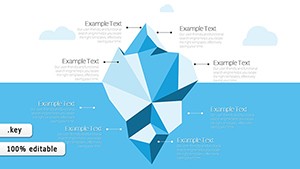
Alternative Solutions Keynote Charts Template: Innovate Your Decision Processes
ID: #KC00531
$23.00
(406)
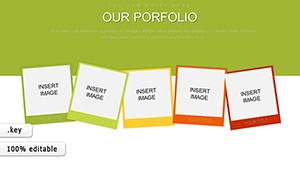
Partnership Organizational Keynote Pie Charts Template
ID: #KC00527
$23.00
(116)
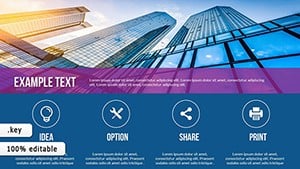
Construction Keynote Charts: Editable Hexagon Processes
ID: #KC00526
$21.00
(499)
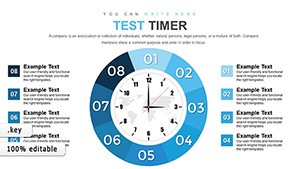
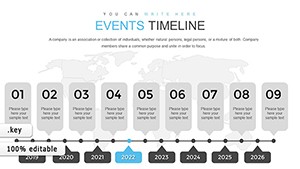
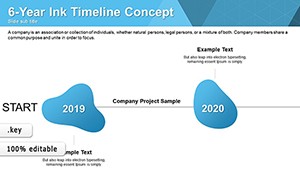
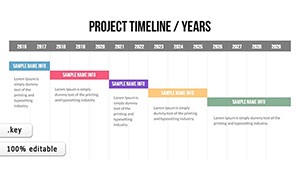
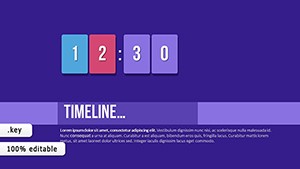
Project Timeline Keynote Charts Template
ID: #KC00500
$20.00
(559)
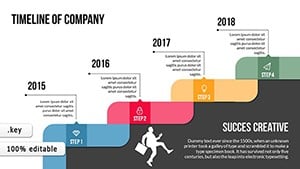
Company Timeline Keynote Charts - Instant Download | ImagineLayout
ID: #KC00498
$20.00
(385)
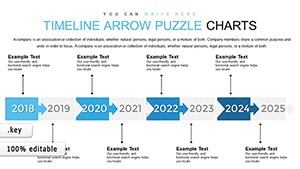
Timeline Maker Keynote Charts: Sequence Your Architectural Masterpieces
ID: #KC00497
$21.00
(430)
Analytical Reviews Keynote Charts: Piecing Together Economic Puzzles
ID: #KC00349
$17.00
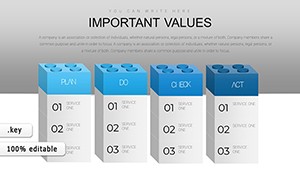
Block Keynote Charts` Brilliance
Our blocks craft cohesion with tessellated designs, eclipsing loose elements with unified canvases. They thrive in foundational roles, supporting expansive narratives.
Advantages: Gradient fills for depth, drag handles for ease.
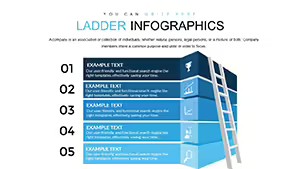
Block Basics
Cascading stacks for levels.
Adhesive joins for flows.
Text wraps for density.
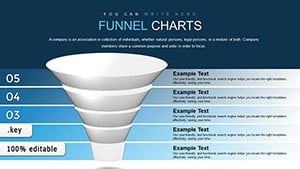
Case Studies in Use
Leaders stack priorities in pyramids. Creatives block inspirations in collages.
Trainers list competencies vertically. Strategists cluster initiatives horizontally.