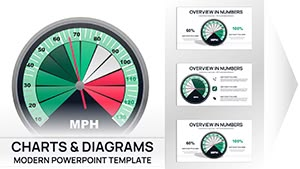
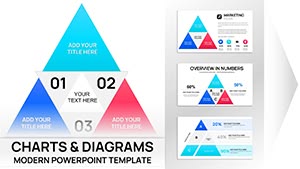
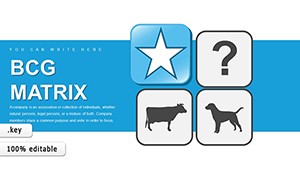
Capture strategic essence through our BCG Matrix Keynote charts, crafted for leaders navigating product landscapes. These visuals dissect growth versus share, guiding from investment to divestment with elegance.
Suited for Apple enthusiasts in consulting or C-suites, charts boast fluid animations and Mac-optimized rendering for crisp projections. Populate with sales trajectories or market intel effortlessly.
Whether dissecting divisional performance or forecasting synergies, they promote insightful dialogues. Keynote`s native integration ensures buttery-smooth transitions, captivating audiences effortlessly.
Enhance with thematic brushes for brand alignment, turning data dumps into narrative gems. Global strategists rely on these for pivotal decisions.
Shed light on opportunities - peruse our Keynote charts and chart your BCG journey today.

Harness Keynote`s power with vector charts that scale flawlessly and shadow effects for depth. Pre-set themes sync with macOS aesthetics, outperforming cross-platform generics.
Link to Numbers for automated refreshes, ideal for live demos.
Basic Keynote charts lack strategic flair; ours embed quadrant legends and hover previews for interactivity. Feedback highlights 35% sharper focus in discussions.
Enhance stars with glow effects, transforming routine reviews into visionary sessions.
Apply for resilient planning, yielding quicker consensus on allocations.
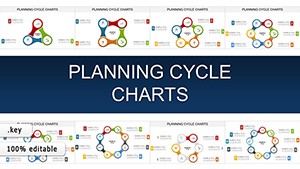
Fuse with mind maps for holistic views or sliders for scenario modeling. In ventures, chart funding rounds against matrix positions.
Educators simulate evolutions via morph transitions for immersive learning.
A CEO leveraged charts for a merger pitch, clarifying post-deal matrices. Remote teams laud version control for iterative refinements.
Enlighten your edge - download a Keynote chart and strategize brilliantly.
Unlock 1,200 words of Keynote mastery. Acquire your BCG chart and illuminate paths to prosperity.
Copyright © 2009-2026 ImagineLayout All rights reserved.