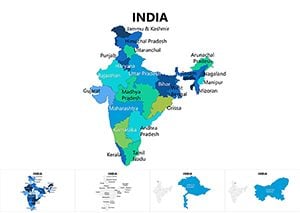
Dive into the diverse landscapes of Asia with our specialized Keynote map templates. Perfect for educators, business analysts, and travelers, these resources bring the continent`s complexity to life on screen. From pinpointing trade routes to illustrating population densities, each template offers precision and flair.
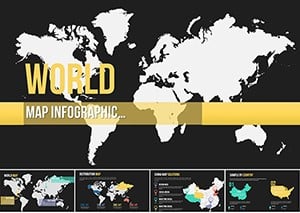
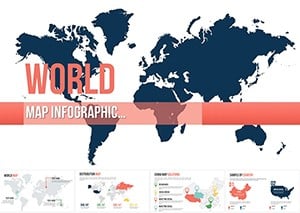
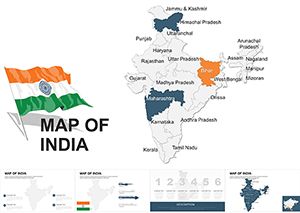
Crafted for Apple Keynote users, they include layered vectors for effortless editing - highlight borders, add labels, or integrate stats without losing quality. Target audiences like international marketers gain tools to showcase market expansions, while historians visualize migration patterns with chronological animations.
Benefits abound: save hours on manual mapping, ensure accuracy with pre-verified data, and impress with professional aesthetics. Whether for classroom lessons or boardroom strategies, these templates foster deeper understanding and engagement.
Start exploring Asia`s vast potential - select a template and chart your course today.
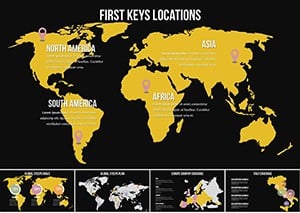
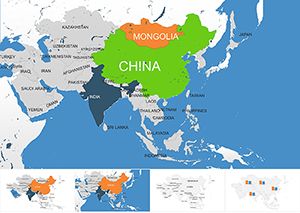
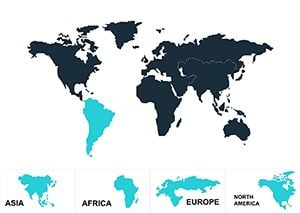
Asia`s influence spans global economics, culture, and geopolitics, making accurate maps indispensable. Our Keynote templates serve multiple scenarios: in business, overlay sales data on country shapes to reveal regional hotspots; in education, animate historical events like the Silk Road for interactive lessons.
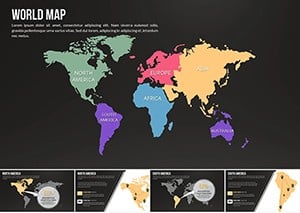
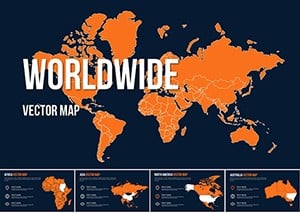
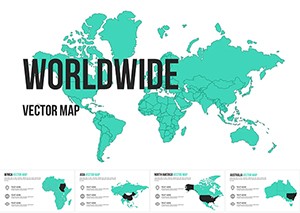
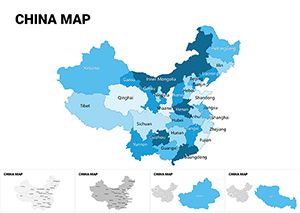
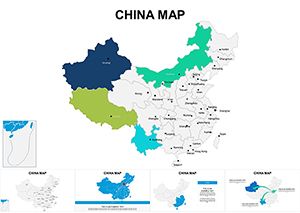
Creative professionals use them for travel blogs, layering photos over terrains, while NGOs map disaster impacts for fundraising decks. Compared to basic drawing tools, these templates provide scalable SVGs that retain sharpness at any zoom, plus thematic color schemes evoking Asian motifs like jade greens and saffron oranges.
Unique value lies in cultural sensitivity - icons represent diverse symbols, from pagodas to modern skylines, ensuring respectful representations. Best practices: pair maps with concise legends, use consistent scales for comparisons, and incorporate user polls for audience involvement.
Picture a logistics firm using a template to optimize supply chains: animated arrows trace routes from Shanghai to Singapore, highlighting bottlenecks. Or a university lecture on climate change, where rising sea levels are simulated over coastal maps. These applications not only inform but inspire action.
For best results, customize by region - focus on Southeast Asia for tourism pitches or Central Asia for energy discussions. Avoid clutter by limiting overlays to three data types per slide.
Transform data into stories that captivate. Download your Asia map template and illuminate insights.
Addressing your mapping needs.
Map out success - your next presentation is just a download away.
Copyright © 2009-2026 ImagineLayout All rights reserved.