Activity charts for PowerPoint are designed for professionals who need to clearly present operational flow, task progression, and business activity cycles. When meetings require more than basic shapes or bullet lists, structured activity visuals help explain how actions move across stages, departments, or timelines. These templates are ideal for managers, consultants, operations teams, educators, and analysts who must communicate process logic with clarity and precision.
Unlike generic diagrams, activity charts focus on movement, transitions, and responsibility shifts. They are especially valuable when presenting workflows, service delivery models, production sequences, or performance tracking systems. Instead of manually aligning arrows and boxes, you can use ready-built layouts that ensure logical structure, visual consistency, and professional presentation quality.


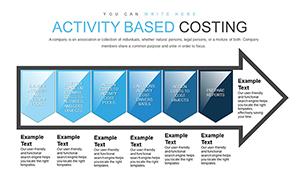


Activity charts are built to show progression. While many PowerPoint visuals focus on hierarchy or static relationships, activity charts emphasize motion, sequence, and operational dynamics. They are structured to illustrate how work flows from one stage to another, who is responsible at each point, and where transitions occur.
Standard shapes in PowerPoint can technically replicate this, but manual construction often results in inconsistent spacing, unclear directionality, and visual clutter. Activity chart templates solve this by providing pre-aligned stages, directional connectors, and balanced layouts that reinforce understanding rather than distract from it.
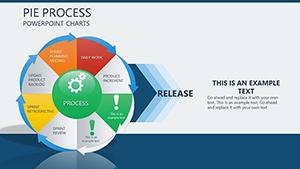
Operations managers use activity charts to present manufacturing cycles, service processes, and internal workflows. Instead of listing steps in text format, visual flow improves comprehension and highlights dependencies between tasks.
Consultants and process analysts often need to identify bottlenecks and inefficiencies. Activity charts allow teams to see the entire process at once, making it easier to pinpoint delays, redundancies, or unnecessary approvals.
While timelines focus on time progression, activity charts emphasize task movement and responsibility shifts. They are particularly effective when showing cross-functional collaboration across departments.
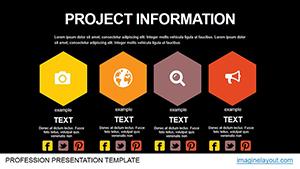
Instructors and corporate trainers use activity charts to explain procedures, systems, and frameworks. Visual sequencing enhances retention and reduces confusion compared to text-heavy slides.
Default shapes require manual alignment, connector adjustments, and formatting decisions that consume time and often result in inconsistent layouts. Activity chart templates provide:
This ensures your presentation communicates structure rather than design improvisation.
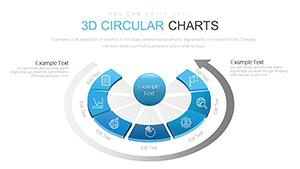
This category typically includes:
Each format addresses a different communication need, helping presenters choose the most effective structure for their objective.
Use verbs instead of generic titles. For example, “Validate Request†is clearer than “Validation.â€
Avoid combining unrelated processes in one visual. Activity charts work best when focused on a single logical progression.
If your workflow includes approvals or branching logic, visually distinguish them using consistent formatting.
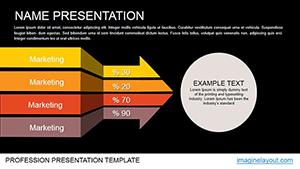
Use color intentionally - for example, one color for departments, another for status, or another for risk areas.
Unlike timeline templates, which prioritize chronological progression, activity charts emphasize operational movement and task responsibility. Compared to organizational charts, they do not focus on hierarchy but on action flow. Unlike generic diagram collections, this category is specifically curated for process-based communication needs.
This distinction helps professionals quickly identify the right visual tool depending on whether they need to show structure, time, comparison, or workflow logic.
These PowerPoint activity chart templates are built for board meetings, consulting engagements, corporate training, academic lectures, and internal reporting sessions. They are fully editable, allowing you to adapt colors, labels, icons, and stages while maintaining structural integrity.
Instead of spending valuable time constructing flow diagrams manually, you can focus on refining your message and analysis.
If your objective is to demonstrate how work progresses, how tasks move between teams, or how processes evolve step by step, activity charts provide the most effective visual solution. They translate operational complexity into structured clarity.
An activity chart is used to visually represent workflows, task sequences, and operational processes. It helps audiences understand how actions move from one stage to another and who is responsible at each point.
A timeline focuses primarily on chronological order, while an activity chart emphasizes operational flow and task movement between stages or departments.
Yes. All activity chart templates are fully editable in PowerPoint, allowing you to adapt labels, colors, icons, and stages to match your industry and organizational structure.
Use an activity chart when you need to demonstrate process progression, task transitions, or workflow logic rather than static relationships or hierarchical structures.
Copyright © 2009-2026 ImagineLayout All rights reserved.