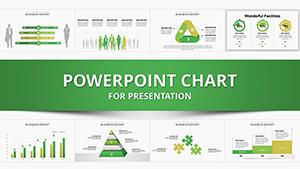
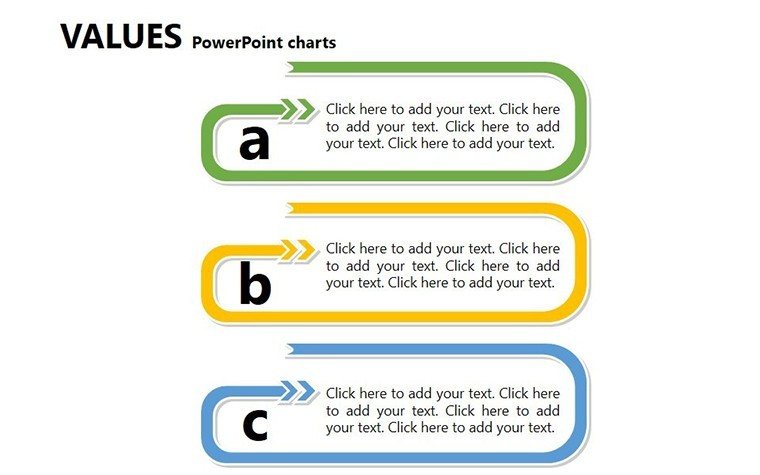
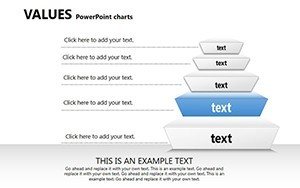
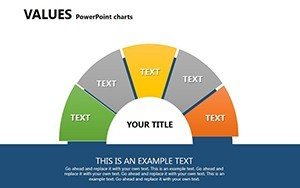
Values PowerPoint Charts - Fully Editable


Type: PowerPoint Charts template
Category: Relationship
Sources Available: .pptx
Product ID: PC00251
Template incl.: 21 editable slides
What's Inside the Download
21 slides arrive in PPTX format ready for immediate use.
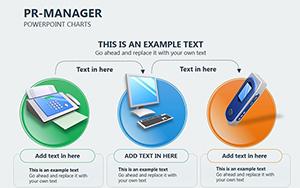
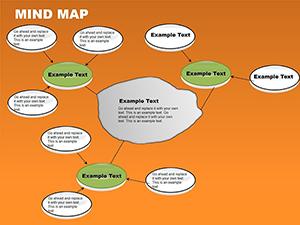
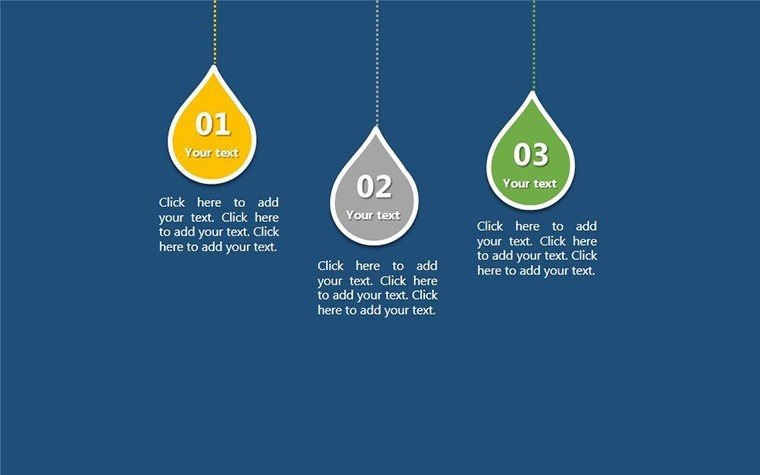
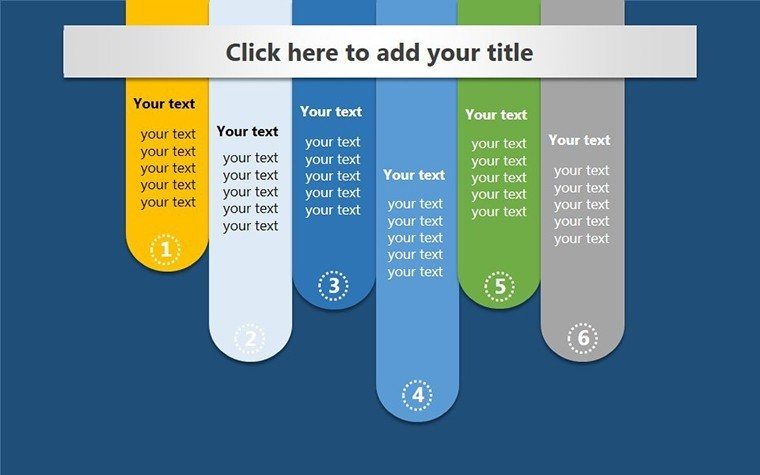
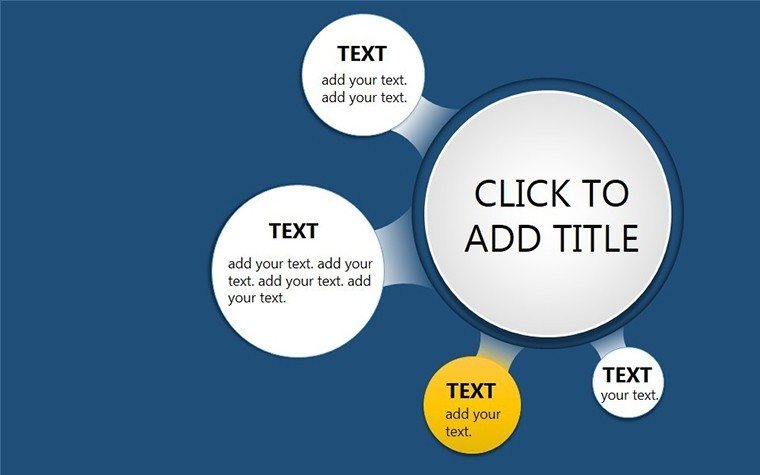
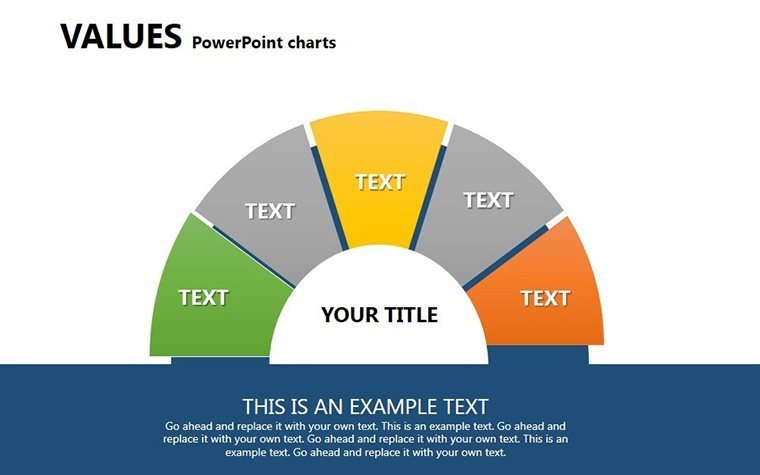
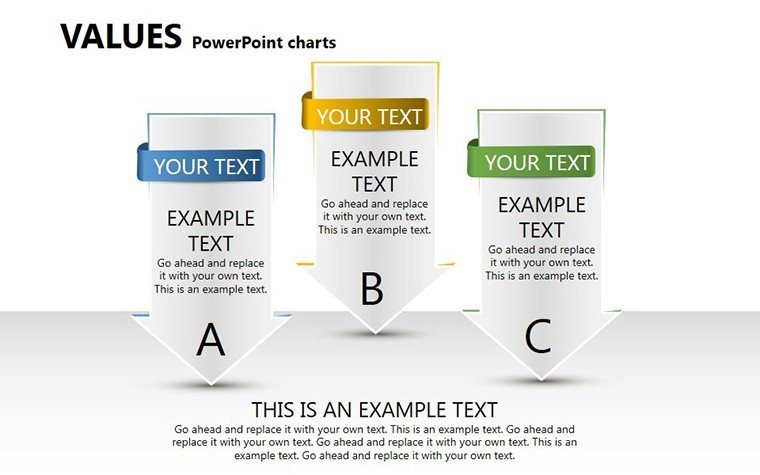
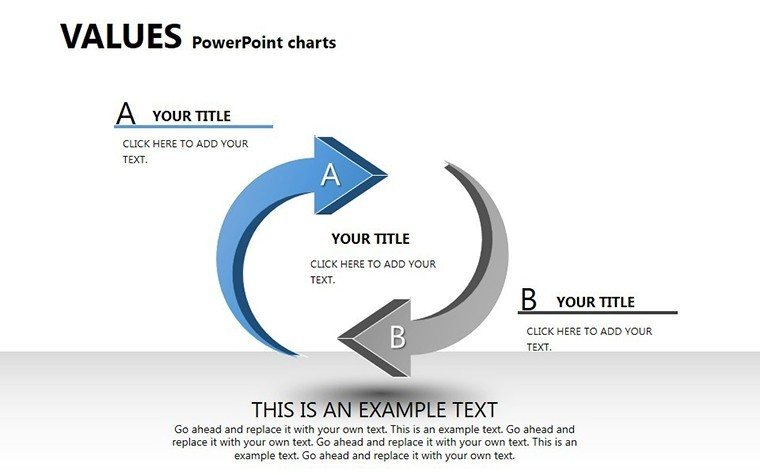
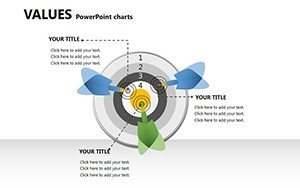
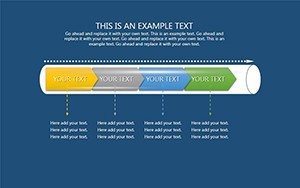
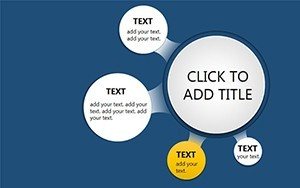
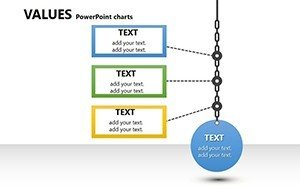
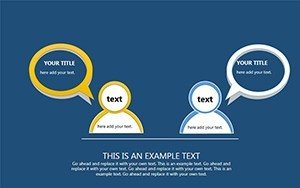
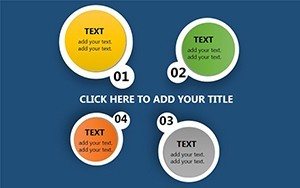
Each slide combines diagram structures that support strategy meetings by mapping professional values across phases.
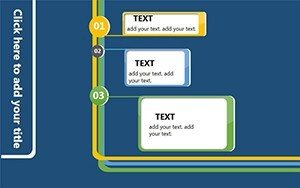
The set stands apart by using color contrast to segment value phases compared to workflow-focused sets while flow direction connects collaboration metrics more clearly than single-chart layouts.
Key Specifications
| Feature | Details |
|---|---|
| Slides included | 21 fully editable diagrams |
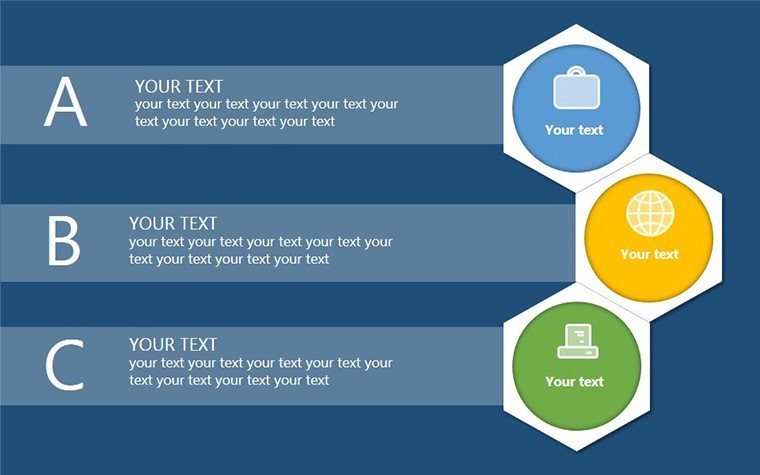
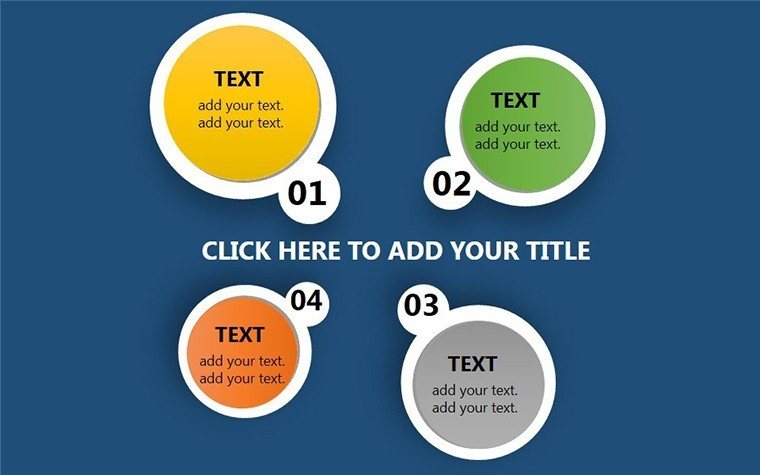
| Editable shapes | segments resize and recolor independently |
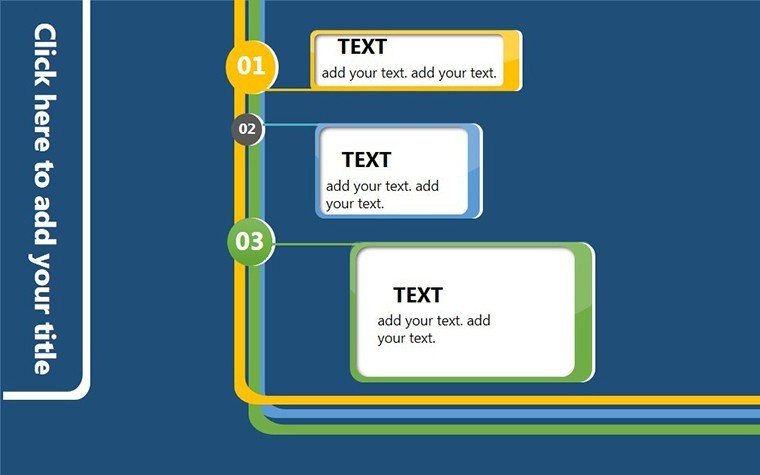
| Text placeholders | labels update without unlocking groups |
| Color theme adjustments | slide master palette changes apply globally |
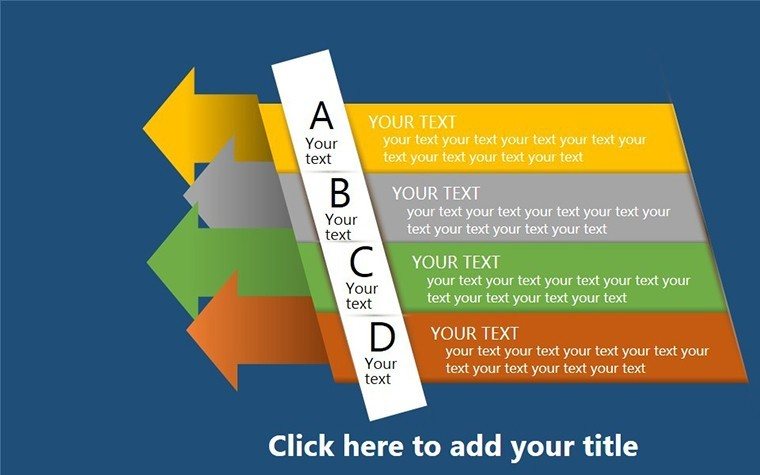
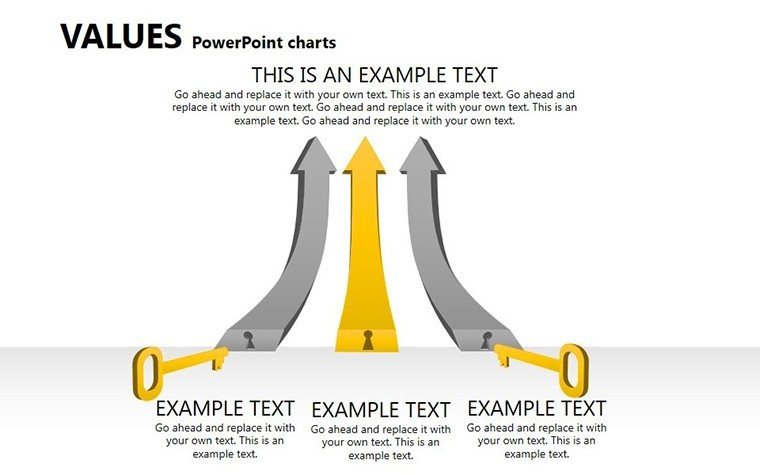
| Diagram connectors | arrows adjust direction and weight |
| Aspect ratio | 16:9 standard |
Typical Use Cases by Role
Strategy Consultant in Consulting Firm
A strategy consultant preparing a quarterly review for a manufacturing client reused the value diagrams across three decks by swapping color schemes and cut preparation time from three hours to 45 minutes.
HR Manager in Technology Sector
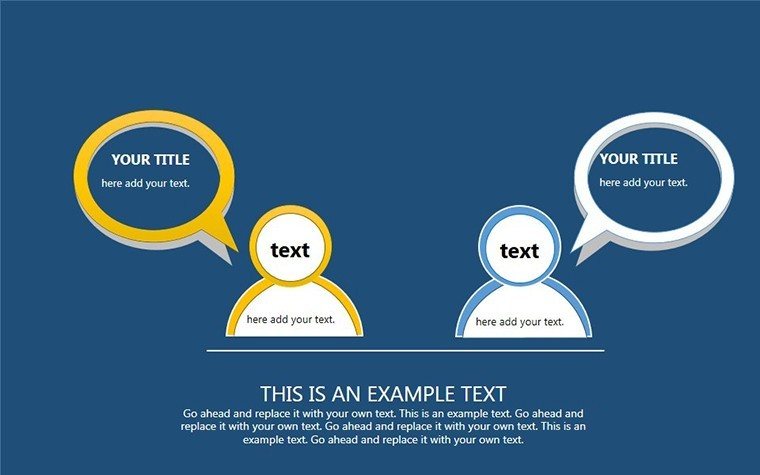
An HR manager in a SaaS company adapted the same file for five consecutive onboarding sessions highlighting team collaboration metrics and maintained consistent visual hierarchy without redesign.
Download the template now and transform your next strategy meeting
Customization in 5 Steps
Editing difficulty is moderate.
- Open the .pptx file in PowerPoint 365 or 2019 (1 minute)
- Replace placeholder text with your content (3 minutes)
- Adjust brand colors via the slide master (2 minutes)
- Edit diagram labels and connectors (4 minutes)
- Export as PPTX or PDF (1 minute)
Why This Template, Not a Blank Slide
Building equivalent value charts from scratch demands at least six hours plus advanced design skill to achieve balanced information spacing.
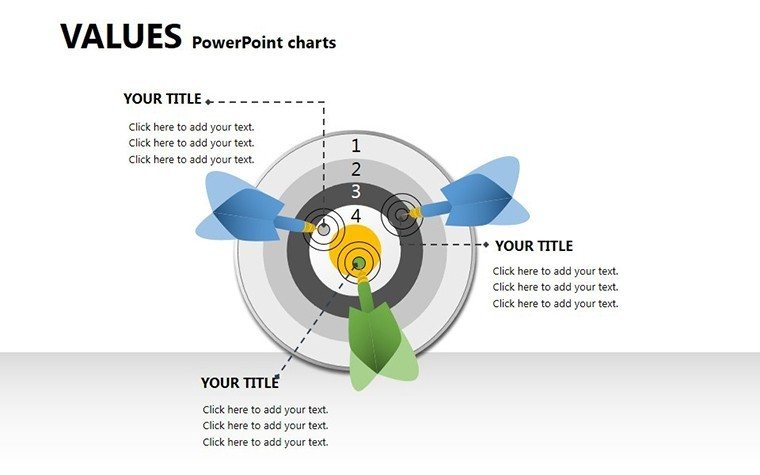
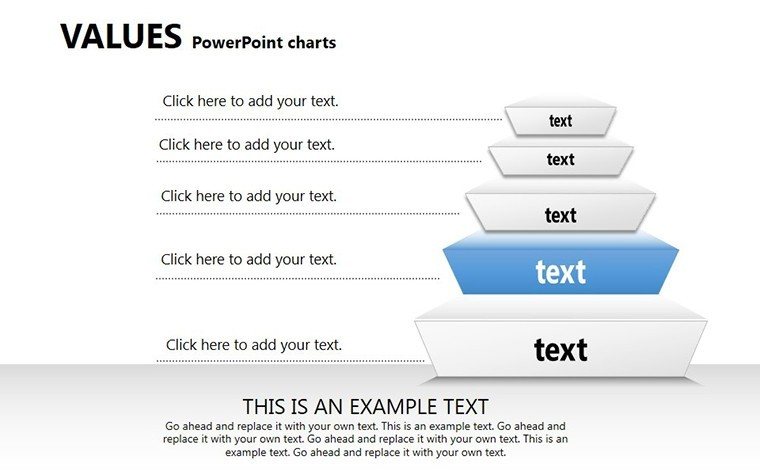
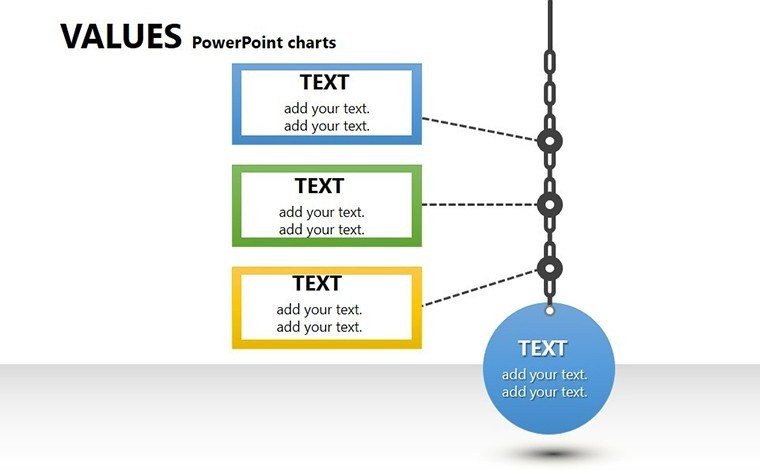
Common errors include overcrowded labels inside shapes that fail on projection screens.
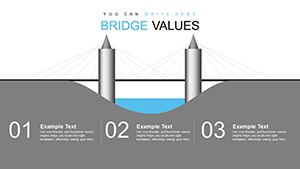
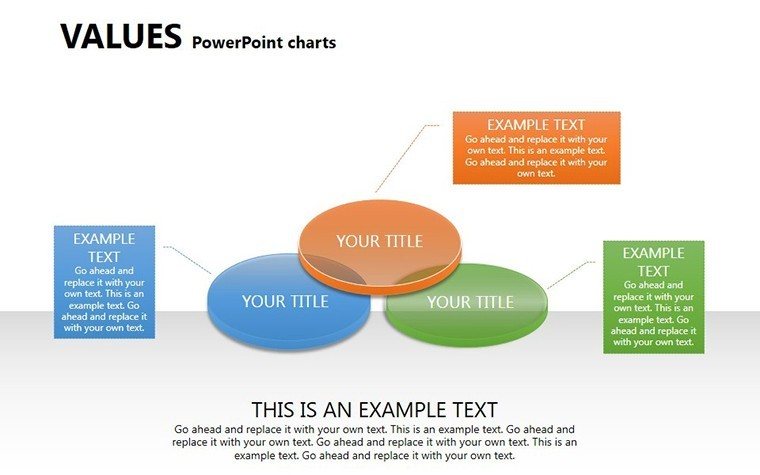
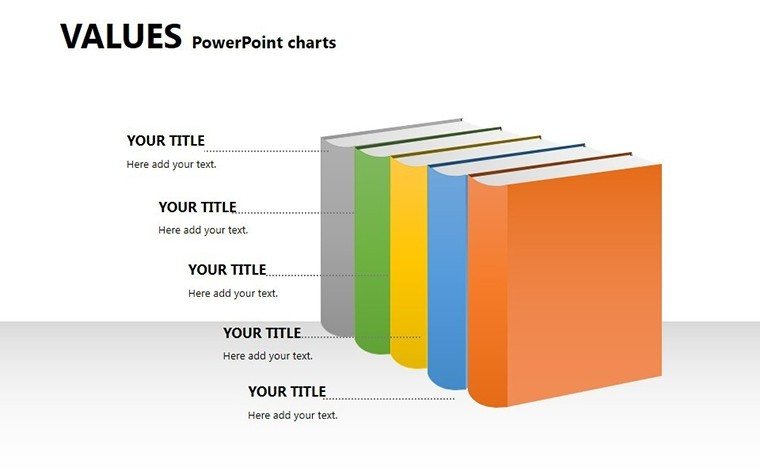
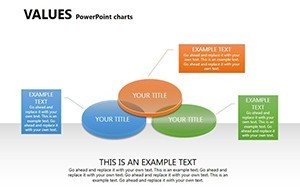
This layout places labels outside shapes connected by thin lines maintaining readability during live board briefings without added complexity.
Many presentations decorate with random colors while this one segments phases for better flow direction and zone segmentation.
Get the Values PowerPoint Charts Template
Which PowerPoint versions open the file?
The PPTX format works in PowerPoint 2016, 2019, 365 on Windows and Mac. Earlier versions may require conversion but lose no core editable shapes. Test in your installed version before the meeting. Compatibility remains high across current Microsoft Office releases.
How do I change the color scheme?
Open the slide master view in PowerPoint. Select the theme colors section and update the palette. All 21 diagrams update automatically through color theme adjustments. Save the file and return to normal view. The process takes under two minutes.
What does the license allow?
Internal company use and paid client work are permitted. Resale or sublicensing of the original file is prohibited. You may export PDFs or images for presentations. The license covers unlimited projects within your organization.
Are free and paid versions different?
The page does not list separate tiers. The download provides the complete 21 editable slides in PPTX. No additional free version appears on the page. All diagram connectors and text placeholders are included in the single file.
What software opens the file?
PowerPoint opens the PPTX directly. Keynote can import it with minor layout adjustments. PDF export works for distribution. No additional software is required for editing. The format compatibility covers current presentation tools.
Is animation supported?
No animation support is indicated on the page. Static diagrams focus on visual hierarchy and information spacing. You can add entrance effects manually in PowerPoint if needed. Removal of any added animation remains simple.