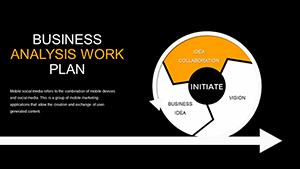
Dive into high-octane presentations with our action-themed PowerPoint chart templates, engineered to make your data explode off the screen. These designs capture the rush of motion - think speeding arrows, surging graphs, and explosive pie charts - ideal for sales teams, project managers, or educators who need to convey urgency and momentum.
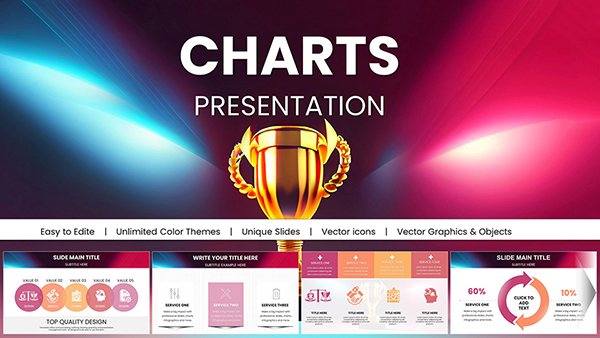
Transform dry statistics into adrenaline-fueled visuals that keep audiences hooked. Compatible with the latest PowerPoint versions, these templates feature smart art integration and animation presets for seamless flow. Businesses in fast-paced sectors swear by them for quarterly reports or pitch meetings, where every slide must propel the narrative forward.
Browse our action-packed collection and download templates that align with your high-energy goals. Elevate your data storytelling and watch engagement soar.
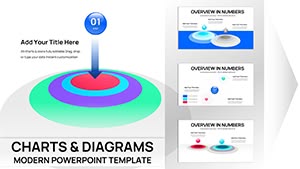

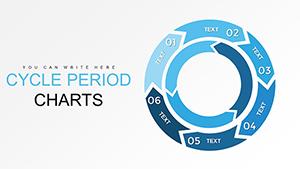
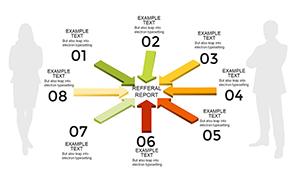


In a world where attention spans are shorter than a sprint, your charts need to move like lightning. Our action templates ditch static bars for kinetic designs: imagine line graphs that "race" across slides or radial charts mimicking a whirlwind. Perfect for marketing analytics or fitness tracking, they infuse energy into numbers, making complex info digestible and exciting.
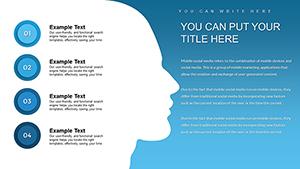
Standard PowerPoint charts feel rigid, like they`re stuck in neutral. Ours shift into overdrive with layered animations - fade-ins timed to reveal insights progressively - and color schemes evoking speed: electric blues and fiery oranges. This not only boosts comprehension but also amps up retention, as dynamic visuals can increase audience recall by up to 65%.
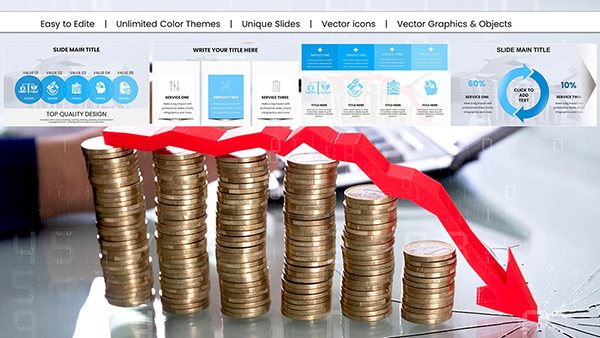
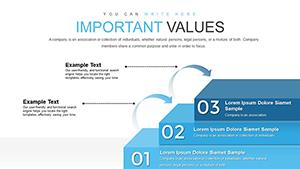
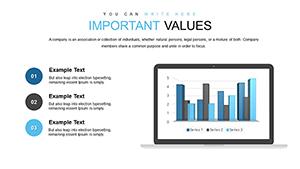
Take our "Velocity Surge" template: a bar chart where bars "launch" upward with particle effects, ideal for e-commerce trend reports. Swap in your data via Excel links for real-time updates, and add callout boxes for key takeaways that pop like fireworks.
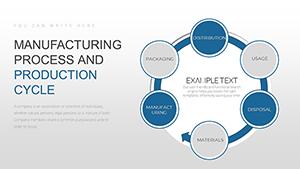
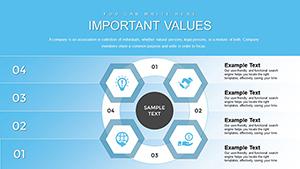
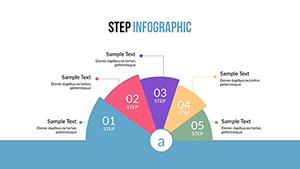
Start by aligning chart types to your story - use waterfalls for cascading impacts in budget breakdowns. Limit data points to five per visual to avoid clutter; instead, layer in micro-animations that reveal details on click. For accessibility, ensure high contrast and alt text descriptions, making your slides inclusive without sacrificing speed.
Pro tip: Embed hyperlinks in chart legends to jump to supporting slides, creating a non-linear flow that mirrors real action sequences. These techniques ensure your presentations don`t just inform - they ignite action.
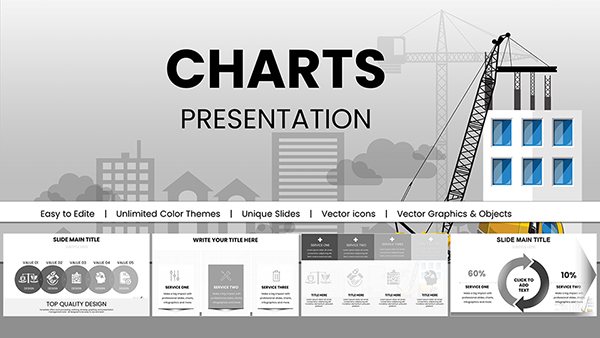
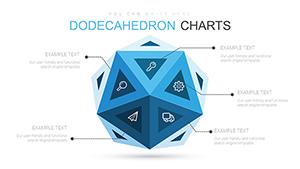
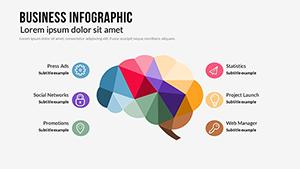
Basic charts are like economy cars: reliable but uninspiring. Our action variants are sports cars - sleek, powerful, with turbo-charged features like morph transitions for fluid data shifts. Value add: Built-in icons libraries for instant thematic enhancement, saving hours of design time.
Curious to accelerate your next deck? Explore action chart templates here and download the spark you need.
Yes, designed for PowerPoint 2016 and later, with fallback options for earlier builds to maintain full functionality.
Use the built-in animation pane: select elements and apply entrance effects like "wipe" or "zoom" to simulate motion.
Absolutely - paste from Excel or link directly for automatic syncing, keeping your charts always current.
Optimized for responsive viewing; test in PowerPoint`s mobile app for seamless on-the-go edits.
They incorporate velocity and energy motifs, transforming passive data into active, story-driven visuals that captivate.
Yes, edit the master slide colors to match your brand, with changes applying globally across all charts.
Hit the gas - download your action charts today and make data move.
Copyright © 2009-2026 ImagineLayout All rights reserved.