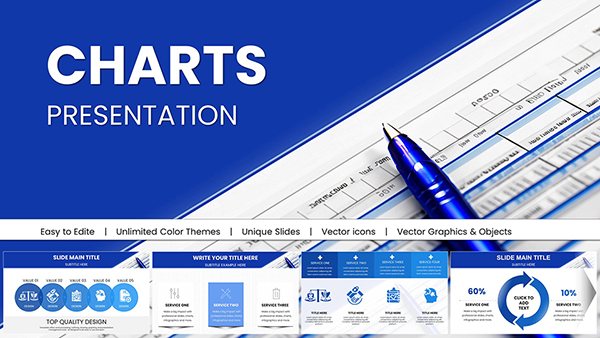
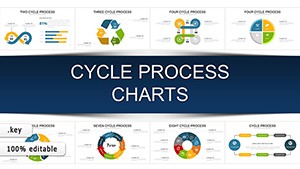
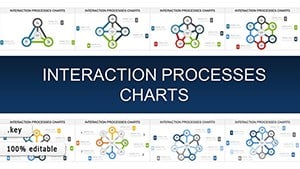
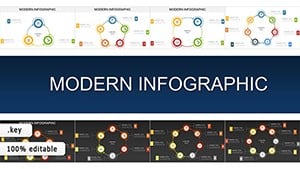
Enhance your Keynote decks with abstract chart templates that fuse data precision with creative expression. For speakers, analysts, and trainers, these visuals - think morphing bars and spectral lines - distill complexities into digestible artistry. They make stats sing, perfect for conferences or internal reviews.
Native to Keynote, tweak via drag-and-drop for colors, labels, and motions. From subtle schemas to dramatic depictions, variety abounds. Retina-ready for sharp projections.
Ditch dull diagrams for abstracts that amplify. Scan selections, claim a match, and download unlocked files. Spark smarter sessions starting here.
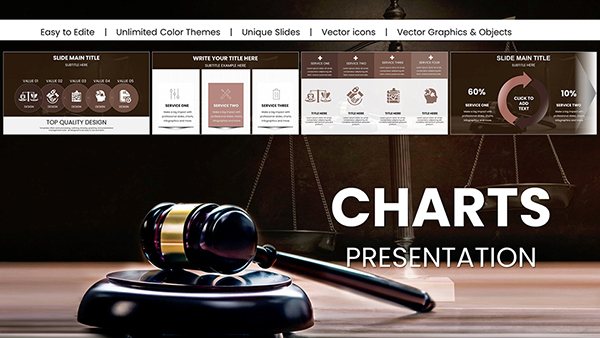
In Keynote, abstract charts reimagine data as design, outshining basic builds with evocative forms. Vital for consultants and educators conveying trends poetically. Finance visuals gain depth; science slides, wonder.
Prime Benefits
Seamless Builds: Animate abstracts for dramatic unfolds.
Theme Sync: Match deck aesthetics fluidly.
Insight Amplification: Forms highlight patterns intuitively.
Presenter polls show 45% engagement boosts.
Contextual Applications
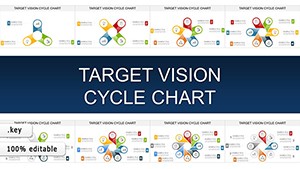
CEOs chart visions with orbital abstracts; teachers model ecosystems via web-like nets. Non-profits graph impacts through growth vines.
Targeted Tactics
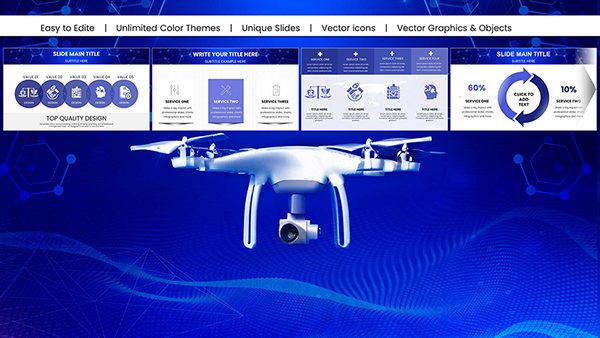
Strategy Sessions: Abstract radars for SWOTs.
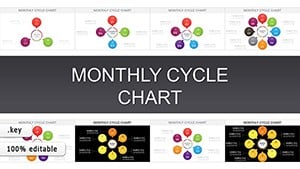
Performance Recaps: Wave charts for metrics.
Trend Forecasts: Helix spirals for projections.
Practice: Anchor data to axes lightly; prioritize motion cues.
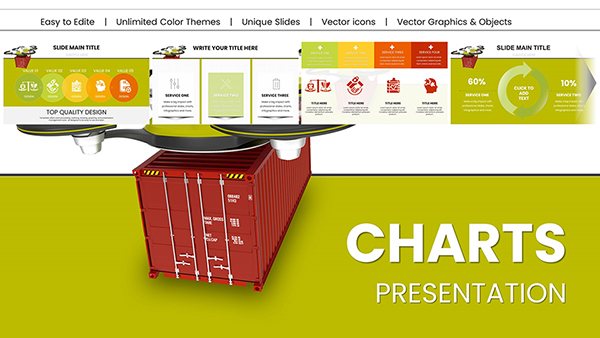
Template Distinctions
With shape libraries and export tools, try "Aether Lines" for flows or "Prism Pies" for shares. Acquire now for chart charm.
Pro Pointers and Cases
Calibrate for projectors; blend with transitions. Success stories: Abstracts clinched deals via clarity.
Employ shadows for 3D illusions sparingly.
Frequently Asked Questions
Chart creatively. Peruse further for Keynote wonders.